
FIGURE 2.
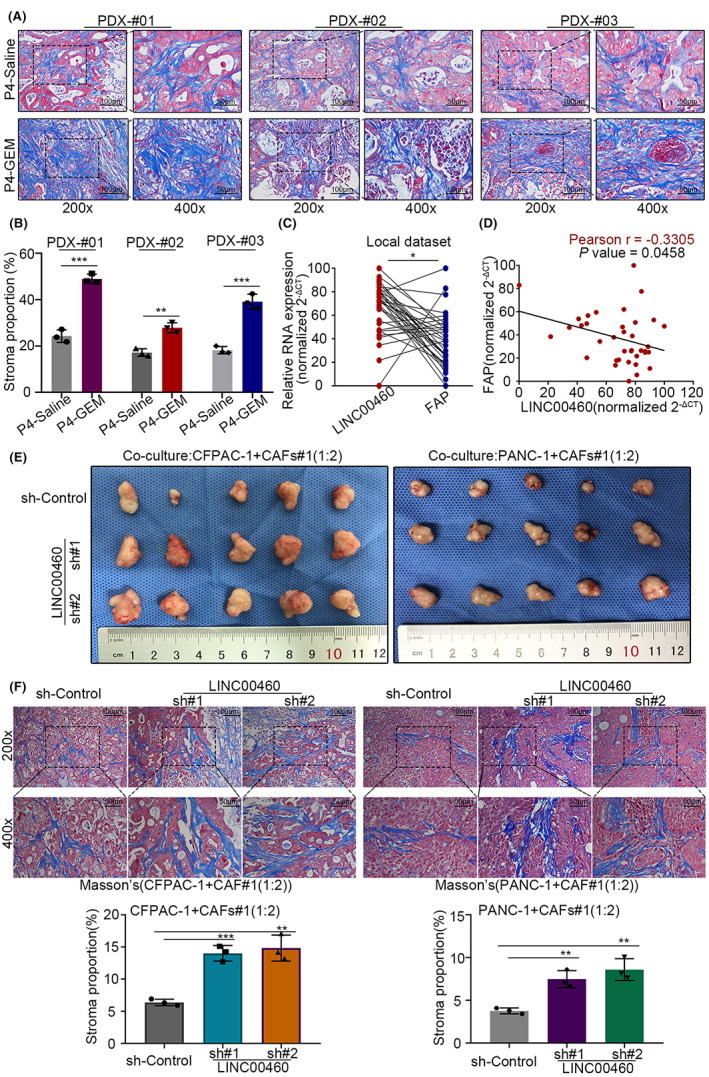
LINC00460 could modify the extracellular matrix. (A) Masson trichrome staining of PDX tumor samples. (B) Histogram plot showed the stroma proportion of the PDX tumors in (A). (C) Paired dot plot showed the relative expression level, measured by qRT‐PCR, and the correlation of LINC00460 and FAP in human PDAC tissues. (D) Plot showed the direct correlation between LINC00460 and FAP, based on the result of (C). (E) Xenograft tumors from respective groups are shown. (F) Masson trichrome staining of xenograft tumor samples with sh‐LINC00460 and sh‐Control, histogram plot showed the stroma proportion of the xenograft tumors.