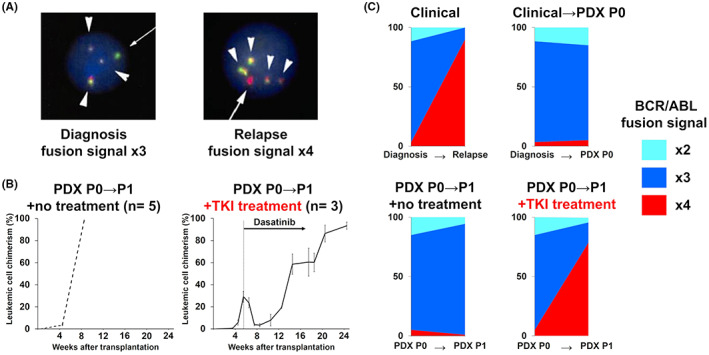
FIGURE 5.

Treatment‐induced clonal selection reproduced in a patient‐derived mouse model. (A) Multiplexed‐FISH analysis showing the BCR‐ABL1 fusion signal in patient samples collected at diagnosis (left) and at relapse (right). Original magnification ×100. Arrowheads, yellow fusion signal; arrows, probe signals. Probe combinations were as follows: BCR, green; ABL1, red. (B) Human leukemic chimerism levels in the BM of PDX mice over time in untreated (left, n = 5) and dasatinib treated (right, n = 3) mice. Data are presented as means with standard deviations. (C) Patterns of cytogenetic subclonal populations. Clonal stability, with no change in the dominant clone between transplantation without treatment, is observed in upper right and lower left charts. Clonal selection with a minor population becoming dominant at relapse in the clinical setting was reproduced in PDX mice (lower right chart).
