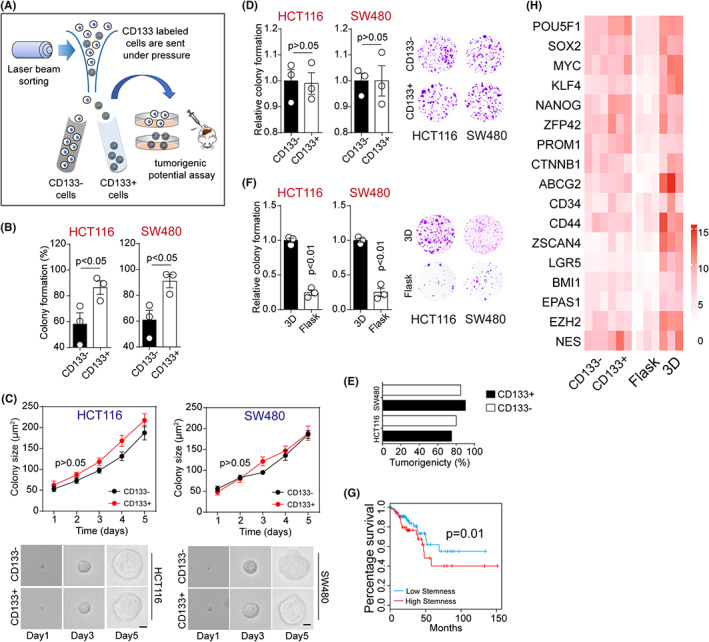
FIGURE 1.

3D gels induced dedifferentiation of colorectal cancer cells. A, CD133− and CD133+ cells were sorted by flow cytometry, and tumorigenic potential was determined by colony formation and tumor bearing mice assay. B, Colony formation rates of CD133− and CD133+ HCT116/SW480 cells in 3D fibrin gel at 5 days. HCT116, p = 0.49; S4480, p = 0.29. C, Colony sizes of CD133− and CD133+ HCT116/SW480 cells in 3D fibrin gel. The scale bar is 25 μm. D, Colony formation of 3D fibrin–cultured CD133− and CD133+ HCT116/SW480 cells was examined in flask. E, The tumorigenic rates of mice subcutaneously injected with 104 3D fibrin–cultured CD133+/− HCT116/SW480 cells. F, 3D fibrin gels–cultured HCT116/SW480 cells were collected and cultured in flask or 3D fibrin gels for 5 d again. After that, the colony formation capability of tumor cells was examined in flask. HCT116, p = 0.001; SW480, p = 0.004. G, The survival analysis of colorectal patients with high/low stem‐associated gene signature in TCGA database (n = 455). H, The heatmap of the stem‐associated genes in CD133+/− HCT116 and flask/3D fibrin–cultured HCT116 cells is shown. ΔCT = CT (target gene) – CT (GADPH). The data are presented as means ± SEM of three independent experiments
