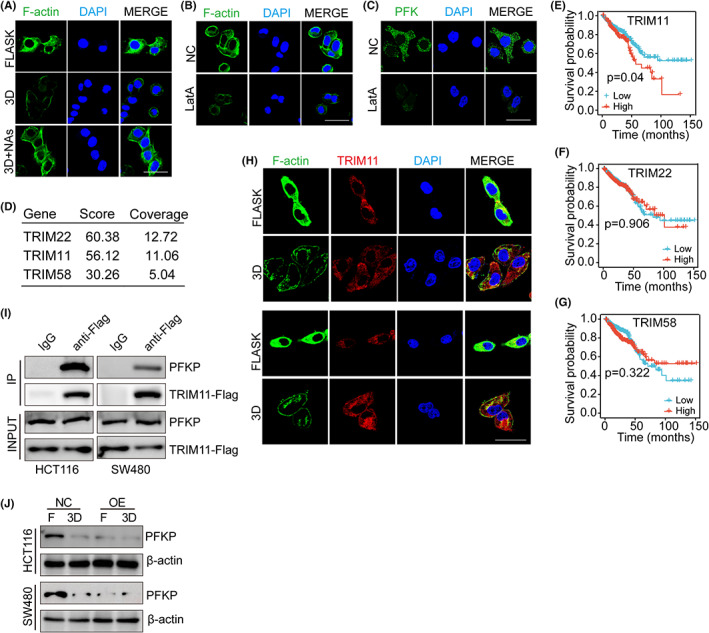
FIGURE 4.

F‐actin binding released TRIM11 to degrade PFK. A, Immunofluorescence staining of F‐actin in HCT116 cells cultured in flask or 3D fibrin environment (containing 10 μg/ml ITGB1 neutralizing antibodies [NAs] or not). The scale bar is 20 μm. B, Immunofluorescence staining of F‐actin in HCT116 cells treated with NC or LatA (1 μM). The scale bar is 20 μm. C, Immunofluorescence staining of PFK in HCT116 cells treated with NC or LatA (1 μM). The scale bar is 20 μm. D, The HCT116 cells were lysed and immunoprecipitated with anti‐F‐actin or IgG antibody. The proteins immunoprecipitated were run on SDS‐PAGE gel and processed for mass spectrometry. The candidate genes are listed. E, Kaplan‐Meier analysis of TRIM11 mRNA expression in patients from TCGA database (N = 455). F, Kaplan‐Meier analysis of TRIM22 mRNA expression in patients from TCGA database (N = 455). G, Kaplan‐Meier analysis of TRIM58 mRNA expression in patients from TCGA (N = 455). H, Immunofluorescence staining of F‐actin and TRIM11 in HCT116 cells (up) or SW480 cells (down) cultured in flask or 3D fibrin environment. The scale bar is 20 μm. I, The Western blotting analysis of PFKP and TRIM11from total HCT116/SW480 cell lysates (input) and proteins immunoprecipitated (IP) with anti‐FLAG or control immunoglobulin G (IgG) cells. J, Expression of PFKP in HCT116 or SW480 cells transfected with NC plasmid or pCMV‐TRIM11 in flask or 3D fibrin environment
