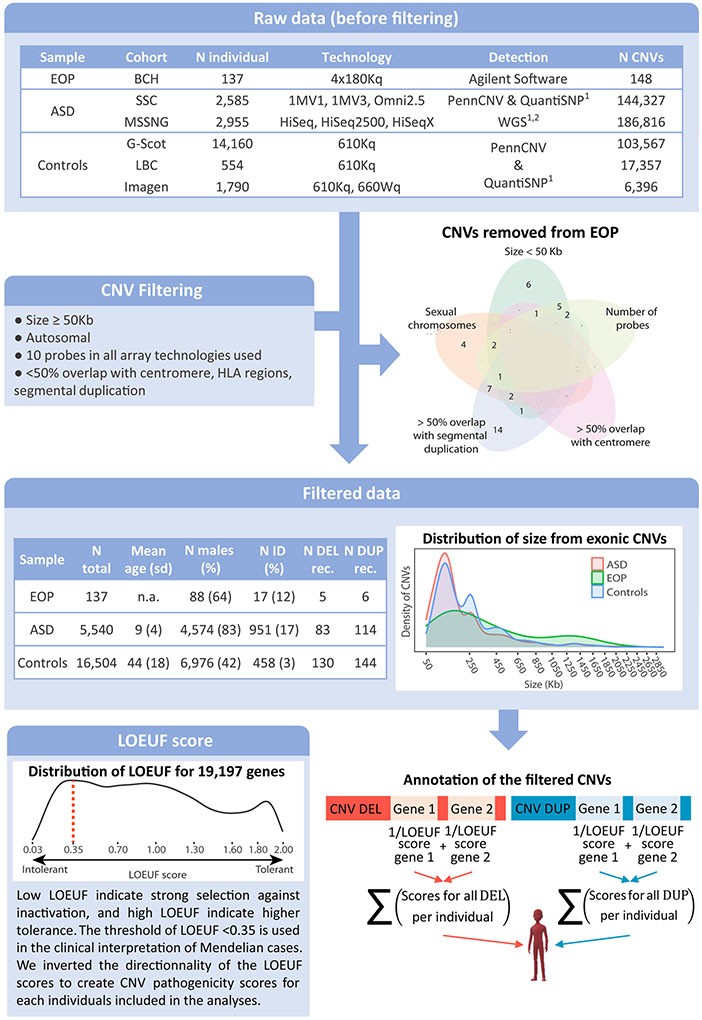
Figure 1: Methodological pipeline for CNV filtering and annotation.
The first table describes CNVs identified in the EOP, ASD and unselected cohorts before filtering. The Venn diagram represents distribution of the EOP CNVs discarded in function of the filtering criteria to which they belong: size is >50 Kb; fewer than 10 probes in at least one of the technologies used; overlap with a centromere or a segmental duplication (<50%); or positioned on a sexual chromosome. The second table indicates the prevalence of filtered CNVs, demographic and comorbidity data for EOP, ASD and controls samples. The first density plot presents the distribution of the size of the genome-wide CNVs included in the analyses across the different samples (EOP in green, ASD in red, unselected population in blue). The CNV sizes on the x axis are represented with a square root transformation. The final density plot represents the distribution of LOEUF score across 19,197 coding genes. A LOEUF score ≤ 0.35 is the defined clinical threshold for intolerant genes. For CNV annotation, the coding gene totally encompassed in deletions and duplications were identified and the LOEUF score of each gene was attributed. For each individual, the number of gene encompassed and the 1/LOEUF scores for deletions and duplications were summed separately. CNV: copy number variant; N: number; EOP: early-onset psychosis; BCH: Boston children hospital; ASD: autism spectrum disorders; SSC: Simons Simplex Collection; Controls: unselected populations; G-Scot: Generation Scotland; LBC: Lothian birth cohort; ID: intellectual disability; N DEL/DUP rec: Number of recurrent deletions/duplications previously associated with neurodevelopmental or neuropsychiatric disorders; LOEUF: loss-of-function observed/expected upper bound fraction.

