
Fig. 3. Metastatic capacity of DNMT3BH tumor cells compared with DNMT3BL cells.
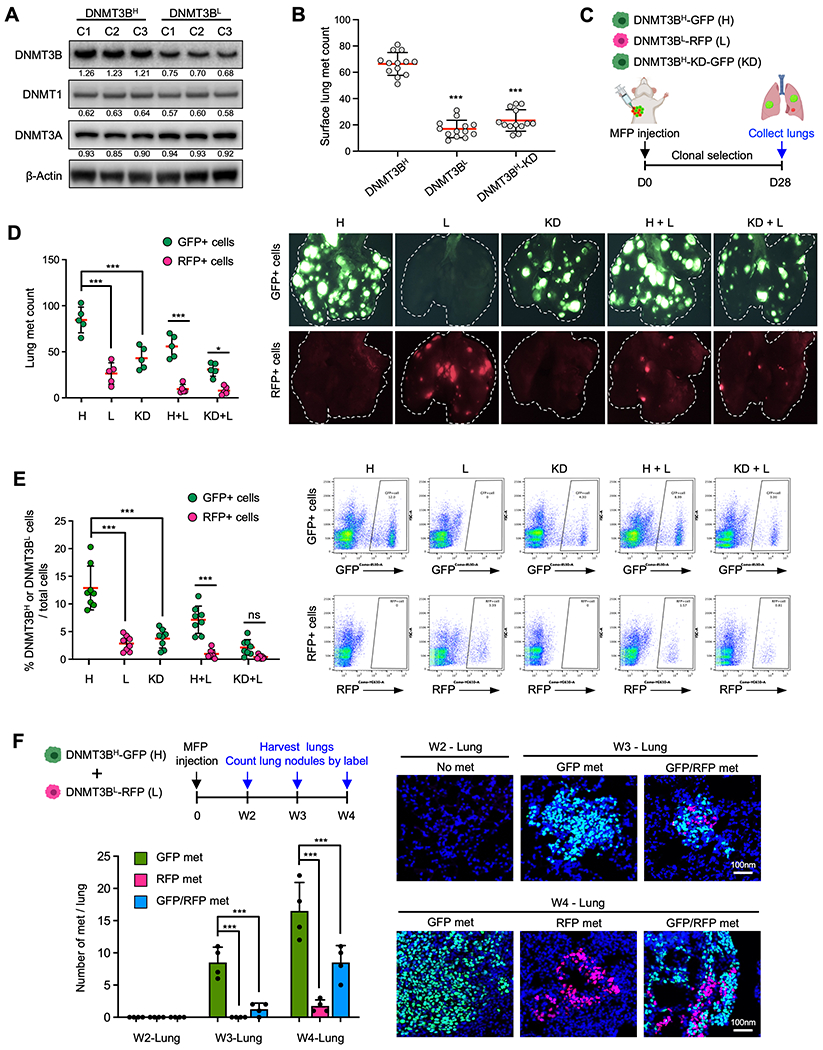
A. DNMT3B, DNMT1, and DNMT4A Western blot for DNMT3BH and DNMT3BL clonal 4T1 cell lines. B. Surface lung metastases (met) counts from mice that received MFP injections of DNMT3BH, DNMT3BL, and DNMT3BH-KD 4T1 cells. C. Schematic experimental design for metastatic potential analysis of DNMT3BH, DNMT3BL, DNMT3BH-KD 4T1 cells. D. Quantitation of DNMT3BH-GFP or DNMT3BL-RFP lung metastases at week 4 from mice that received MFP injection of tumor cells (n=5) (left panel). Representative images are on the right. The white dotted lines indicate the lung boundary. E. Flow cytometry analysis of GFP+ or RFP+ tumor cells at week 4 from the lungs of mice that received MFP injection of tumor cells (left panel), with representative plots of GFP+ or RFP+ tumor cells (right panel). F. DNMT3BH and DNMT3BL metastases in the lungs in a time course experiment (2, 3, and 4 weeks, MFP injection) in which the DNMT3BH and DNMT3BL cells were injected together for clonal competition. Upper left, schematic design; Lower left, quantitative data; Right panels, representative IF images. Quantifications of band density are presented in Western blot. Data are presented as mean ± SD. ** p < 0.01, *** p < 0.001.