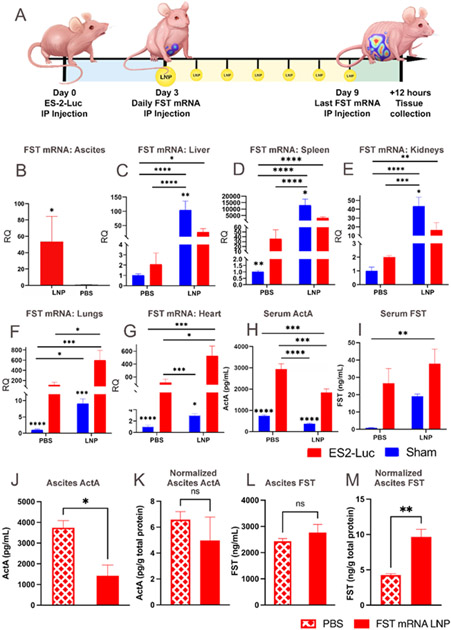
Figure 3. While endogenous upregulation of FST is insufficient to control serum ActA, chronic FST mRNA LNP administration substantially reduces ActA levels.
(A) Experimental design demonstrating ES-2-Luc bearing mice receiving seven daily FST mRNA LNP (10 μg mRNA) injections; the sham group is not shown on the graphic for simplicity. qRT-PCR analysis of FST transcript counts in ascites (B), liver (C), spleen (D), kidneys (E), lungs (F), and heart (G). (H) Serum ActA concentration determined by ELISA. (I) Serum FST determined by ELISA. (J) ActA protein levels in ascites. (K) ActA protein levels in ascites normalized by total protein in ascites. (L) FST protein levels in ascites. (M) FST protein levels in ascites normalized by total protein in ascites. For (B-G), results are mean ± SEM, n=10 for treatment groups (LNP) and n=5 for control groups (PBS), *p<0.05, **p<0.01, ***p<0.001, ****p<0.0001. (B), (J-M) analyzed by t-test; (C-I) analyzed by two-way ANOVA followed by Bonferroni’s post hoc test.

