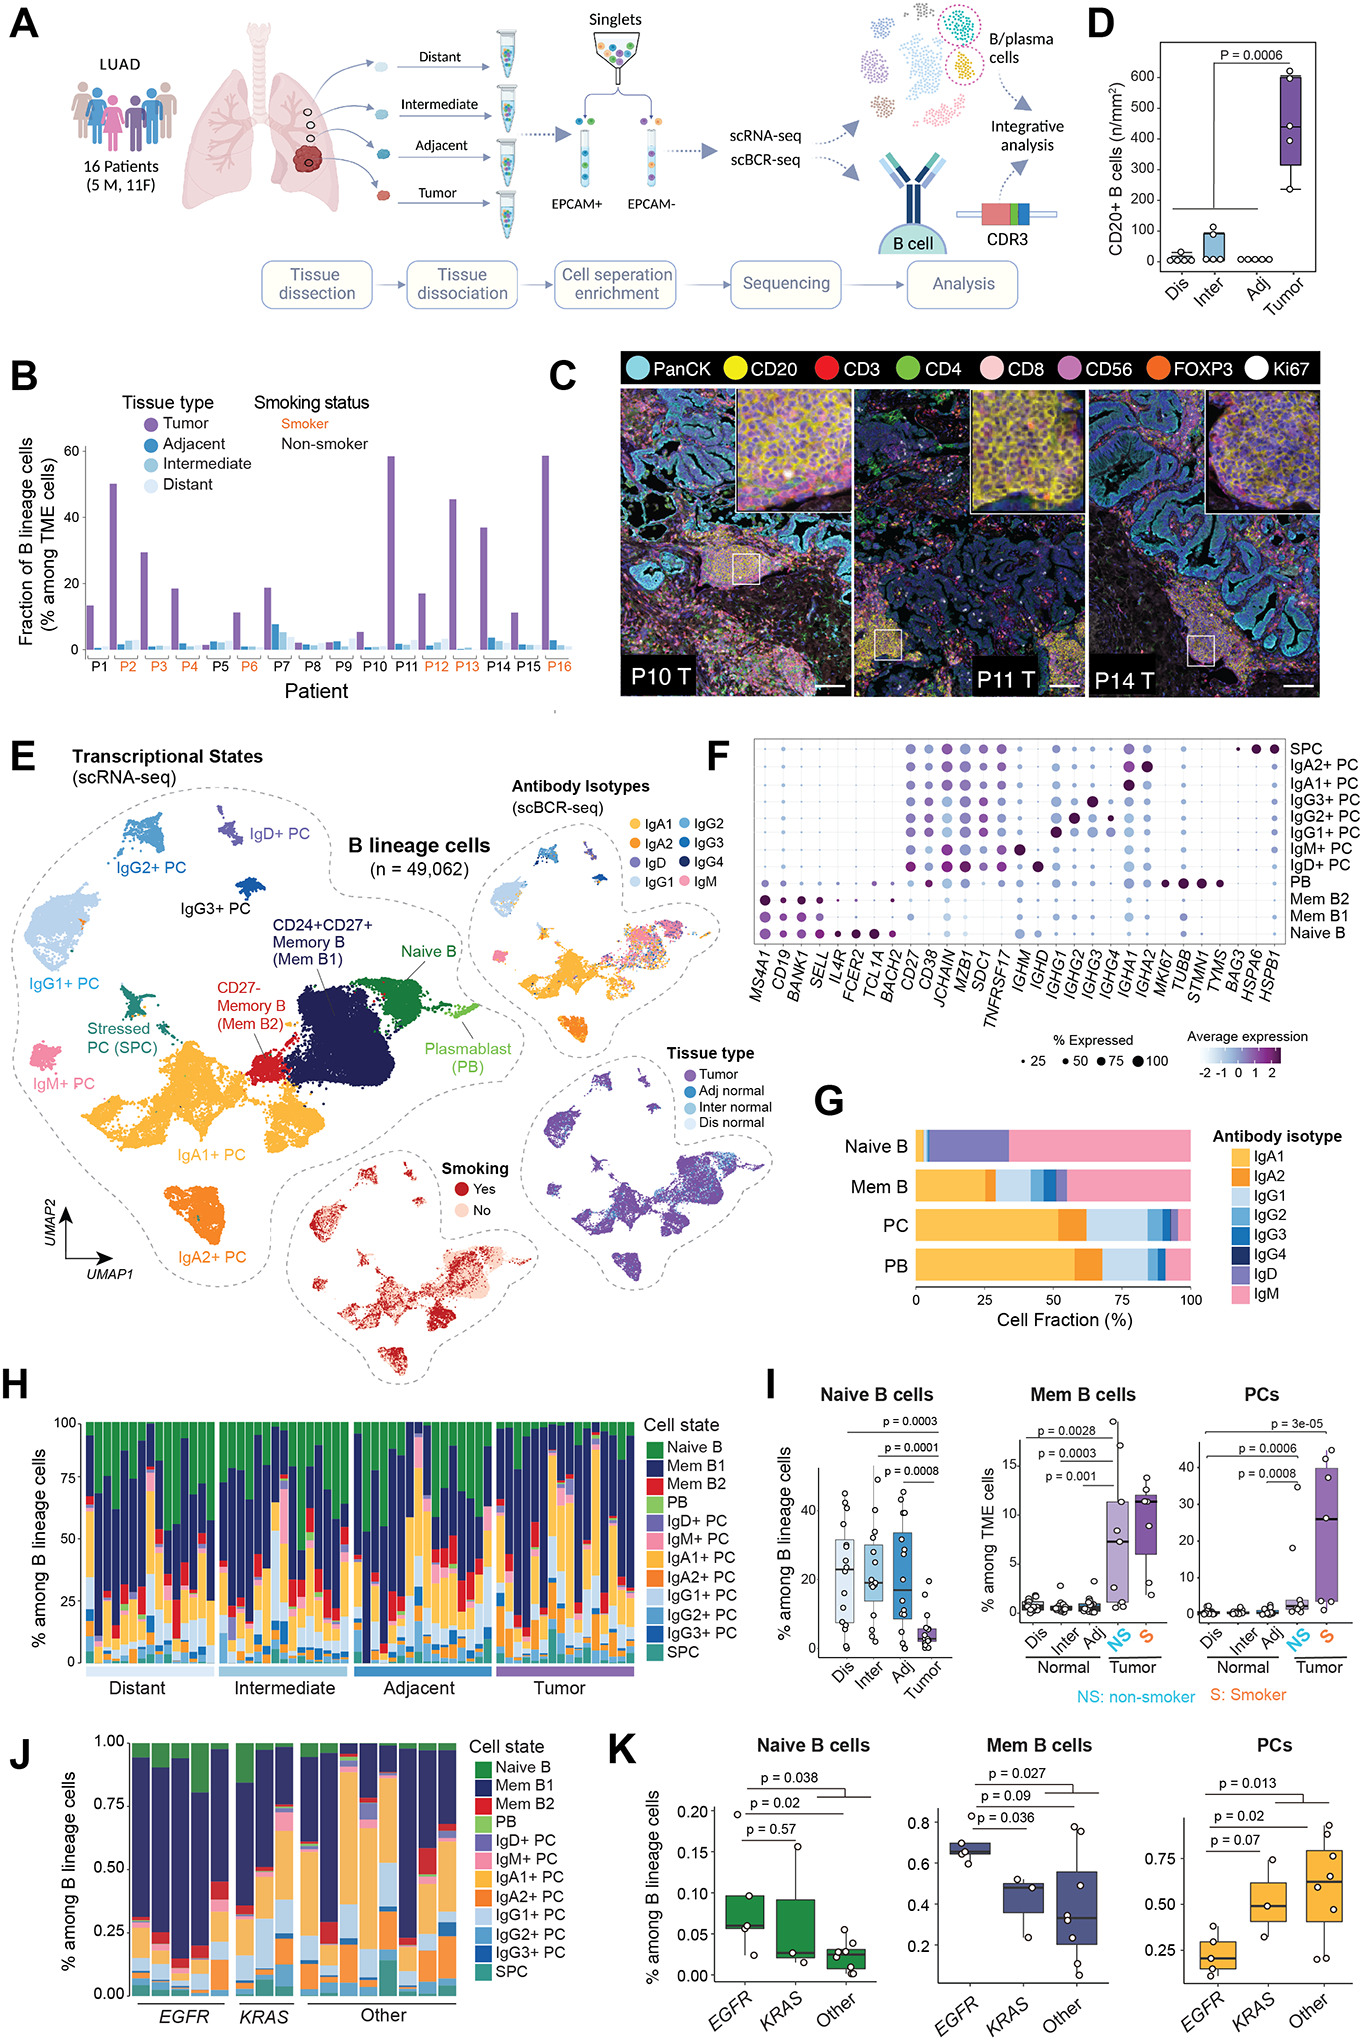
Figure 1. Single-cell profiling of B lineage cells in tumor and matched multi-regional normal lung tissues in 63 samples from 16 patients with early-stage LUADs.

(A) A schematic view of the experimental design, created with BioRender.com. Single-cell RNA sequencing (scRNA-seq) and paired B cell receptor sequencing (scBCR-seq) were performed on EPCAM-negative immune and stromal cell compartments in the tumor microenvironment (TME). Single-cell data generated on B lineage cells were extracted and included in this study. (B) Bar graph showing increased fractions of B lineage cells (among TME cells, i.e., EPCAM-negative cells) in tumor tissues when compared to matched multi-regional normal lung tissues (adjacent, intermediate, distant normal) collected from the same patient (p=1.5e-08, the Mann-Whitney test). (C) Representative images of multiplex immunofluorescence (mIF) showing CD20+ lymphoid aggregates adjacent to areas of PanCK+ tumor cells. mIF was done with a panel of 8 markers on available tissues (n = 20) from 5 of the 16 patients. Scale bar: 100 μm. The inserts are zoomed-in view of CD20+ lymphoid aggregates. (D) Quantification of CD20+ B cells in tumor and multi-region normal lung tissue using mIF. (E) Uniform manifold approximation and projection (UMAP) embeddings of the 49,062 B lineage cells that passed quality control. Cells are color coded by their inferred cell types/states based on transcriptional profiles (left), antibody isotypes using scBCR-seq data (top right), their corresponding spatial location (middle right), and patient smoking status (bottom right). PC, plasma cell; Mem, memory; PB, plasmablast; SPC, stressed plasma cell; adj, adjacent normal; inter, intermediate normal; dis normal, distant normal (same as in panel A). (F) Bubble plot showing proportions and average expression levels of select marker genes for 12 B cell and PC clusters as defined in panel E. More information on cluster-specific marker genes are provided in the Supplementary Table S2. Bubble size indicates the percentage of cells expressing a specific gene in a given cluster, and the color depicts the average expression level of the gene in a cluster of interest and relative to all other cell clusters. (G) Bar graph showing the cellular composition of antibody isotypes in 4 major cell subsets. (H) Bar graph showing the landscape of B lineage cell compositions across all tumor and normal samples grouped by their spatially defined locations (with increasing proximity to tumor from left to right). (I) Boxplot displaying decreased relative fractions of naïve B cell (left, among B lineage cells) and increased fractions of memory B cells (middle) and plasma cells (right) among TME cells in tumor tissues when compared to multi-region normal lung tissues. In the two plots on the right, tumor samples were stratified by patient’s smoking status. NS, non-smoker; S, smoker. P values were determined by Mann-Whitney tests. (J) Bar graph showing the landscape of B lineage cell compositions across all tumor (LUAD) samples grouped by mutation status of LUAD driver gene (e.g., KRAS, EGFR). (K) Boxplots comparing the relative fractions of major B cell subtypes within tumor samples grouped by driver gene mutations. KRAS and EGFR drive mutations were identified using whole-exome sequencing. Mem B, memory B cells; PCs, plasma cells.
