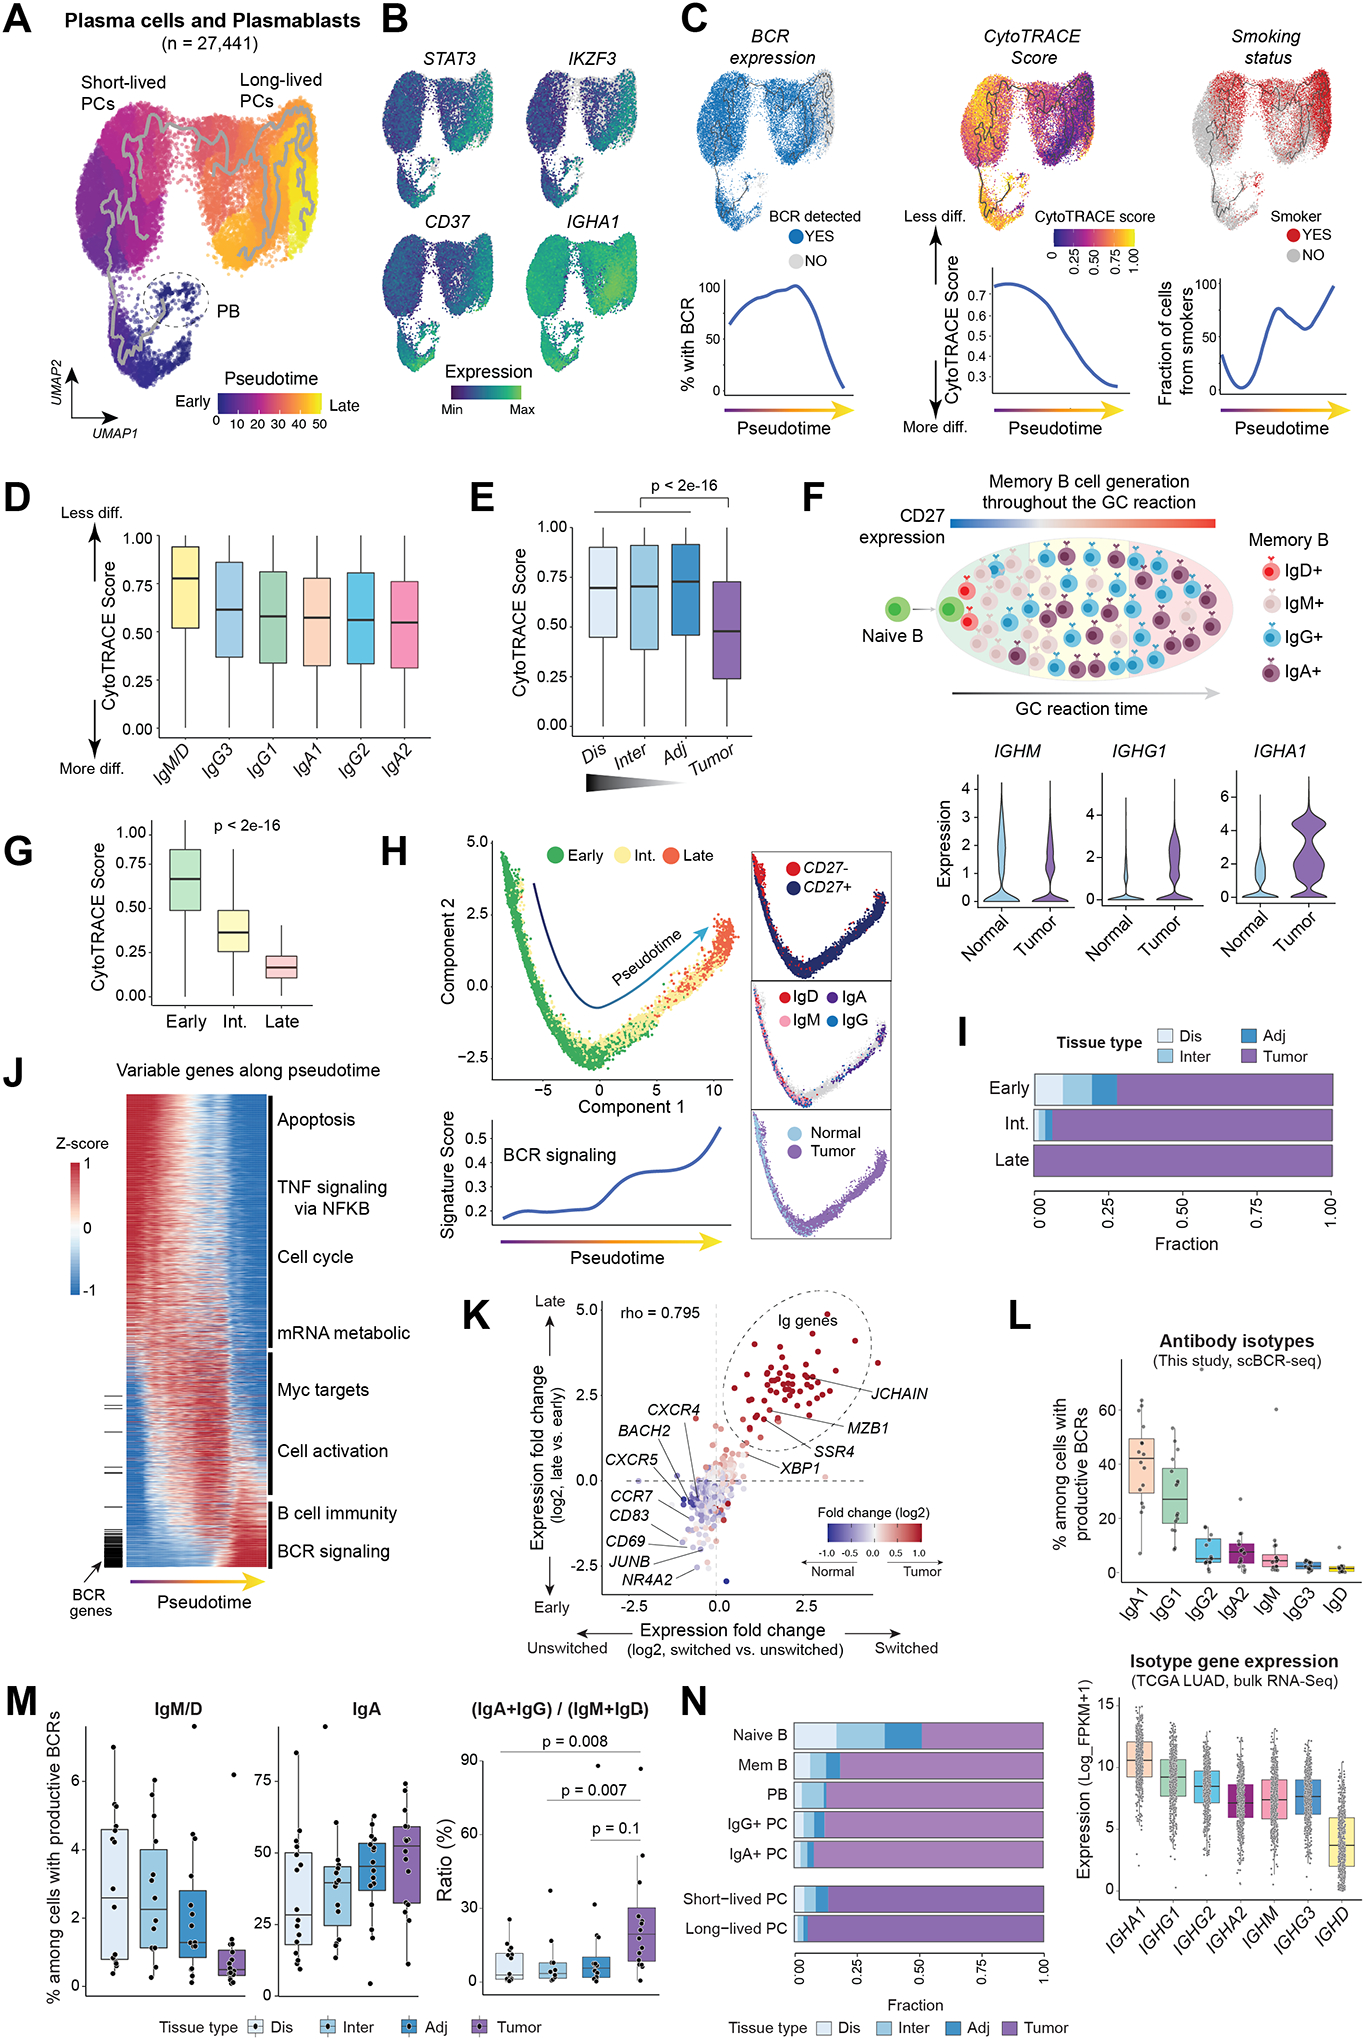
Figure 3. Inference of cell differentiation states and antibody isotypes of PCs and memory B cells in LUADs and matched normal lung tissues.

(A) Monocle 3 pseudotime trajectory analysis of PCs revealed different states of PC differentiation and maturation. PB, plasmablasts. UMAP is colored by inferred pseudotime. (B) The same UMAP as in (A) but with cells color-coded according to gene expression levels of four markers associated with long-lived PCs. (C) (top) The same UMAP as in (A) but with cells color-coded (from left to right) by their BCR expression, corresponding CytoTRACE score, and patient smoking status, respectively. CytoTRACE scores were computed using scRNA-seq data and BCR expression was dichotomized based on the presence of productive BCR clonotype by analyzing scBCR-seq data. Loess smooth curves (bottom) showing (from left to right) fractions of cells with productive BCR, the distribution of CytoTRACE scores, and fractions of smokers, respectively, by pseudotime. Less diff., less differentiated; More diff., more differentiated. (D) Box plots displaying the distribution of CytoTRACE scores across PCs with different antibody isotypes defined using paired scBCR-seq and scRNA-seq data. (E) Comparison of CytoTRACE scores across LUADs and multi-region normal tissues with differing spatial proximities from the tumors (as in Fig. 1A). P value was determined by Mann-Whitney test. (F) A schematic illustration (top) of memory B cell generation in a germinal center (GC) and violin plots (bottom) showing differences in the expression levels of IgH isotypes between LUADs and normal lung tissues. (G) The distribution of CytoTRACE scores in memory B cells at 3 different developmental stages. P value was calculated using the Mann-Whitney test. Int., intermediate. (H) Monocle 3 trajectory reconstruction analysis of B cell differentiation (left). Cells are color-coded by developmental stage, CD27 expression, IgH isotypes, or tissue type (right, top to bottom). A regression line was fitted along pseudotime by a generalized additive model for signature scores of BCR signaling (bottom left). (I) Bar graph showing the difference in tissue compositions across memory B cells at 3 different developmental stages. (J) Pseudotime heatmap ordering of the top 3,000 highly variable genes along the trajectory of memory B cell differentiation. Locations of BCR genes are indicated as a segment (in black) on the left and enriched pathways are labelled on the right. (K) Scatter plot showing gene expression fold change (log2) between late- and early-stage memory B cells (y axis) against the corresponding values of switched and unswitched memory B cells (x axis). Each dot indicates a gene and is color-coded by its corresponding expression fold change between LUADs and normal lung tissues. (L) (top) Box plot showing cellular fractions of antibody isotypes among all B lineage cells with productive V(D)J rearrangements based on paired scBCR-seq data. Each dot indicates a LUAD sample. (bottom) Relative abundances of immunoglobin heavy chain (IgH) isotypes in the TCGA LUAD cohort inferred from bulk RNA-seq data based on the normalized expression levels of each IgH gene. (M) Cellular fractions of IgM+/D+, IgA+ cells (left and middle, respectively) and ratios of IgA+IgG to IgM+IgD abundance (right) across tumor and normal samples. P values were calculated using paired t-tests. (N) Bar graph showing differences in tissue compositions across 7 defined B cell and PC subsets.
