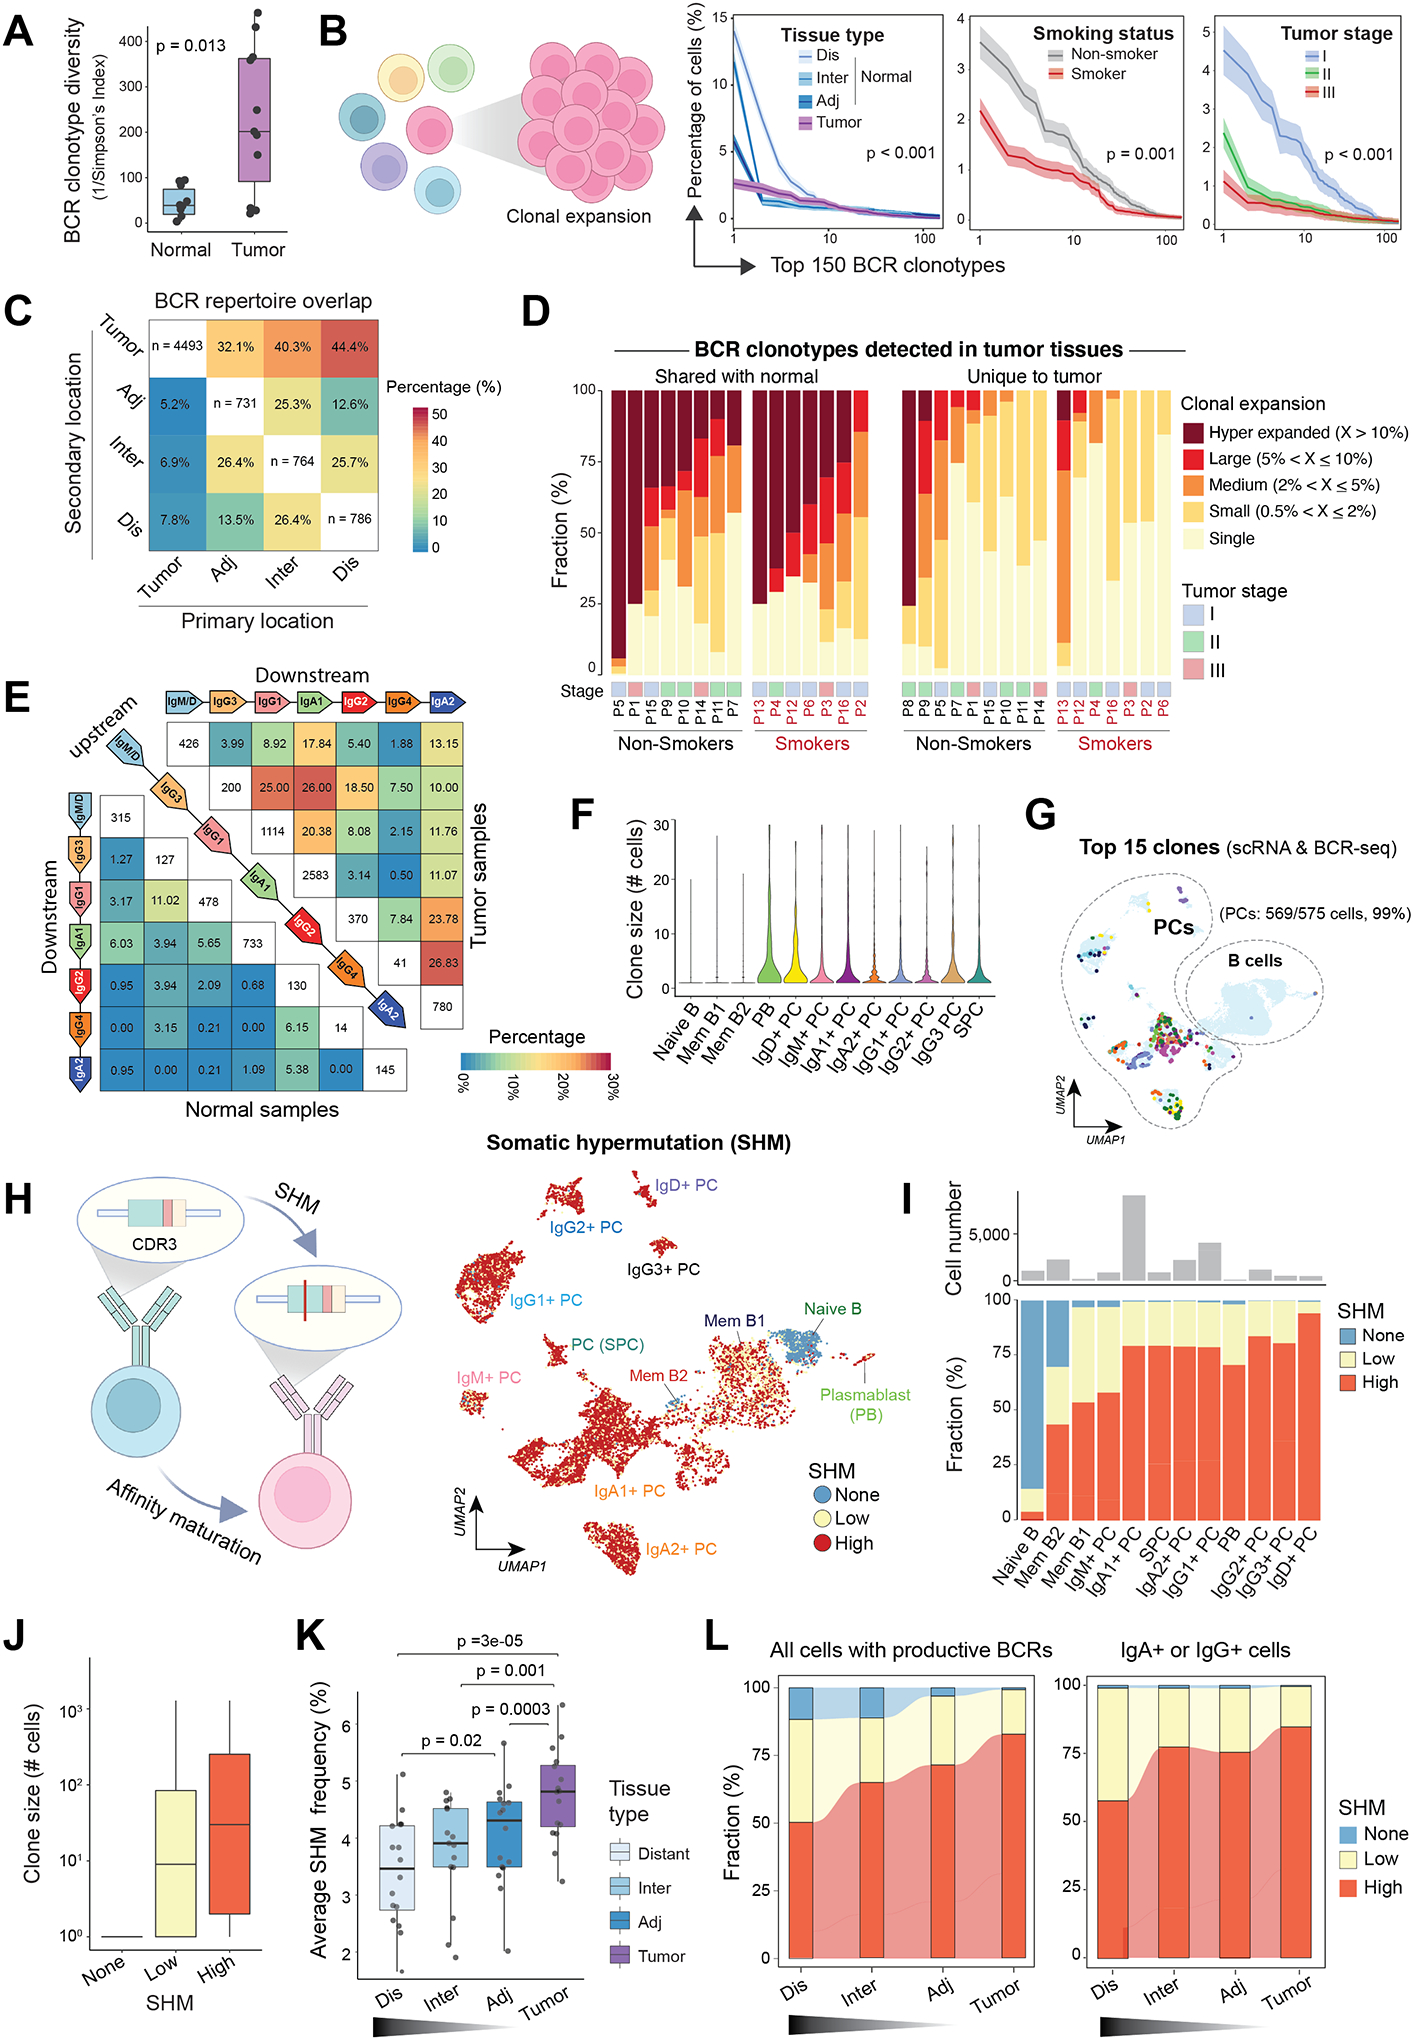
Figure 4. Characterization of BCR clonotype diversity, clonality, and somatic hypermutations in lung tissues based on proximity from primary LUADs.

(A) Boxplots showing differences in B cell receptor (BCR) clonotype diversity scores between LUADs and matched normal lung tissues. Each dot indicates a LUAD patient. P value was determined by the Mann-Whitney test. (B) (left) A schematic illustration of B cell clonal expansion. (right) The clone size distribution of BCR repertoire across groups of different (from left to right) tissue types (location), smoking status, or tumor stages. The top 150 BCR clonotypes are shown. Kolmogorov–Smirnov tests were used for pairwise comparisons. (C) BCR repertoire overlap across spatially defined locations. A BCR clonotype was defined as shared if it was detected in B cells from two or more different samples collected from the same patient. Heatmap showing how the BCR repertoire in samples from a given geospatial location (i.e., the primary location on x axis) overlap with that from another location (i.e., the secondary location on y axis). (D) The landscape of BCR clonal expansion in all patients, stratified by their tissue specificity, i.e., whether a BCR clonotype detected in LUADs shared with their matched normal lung (left) or unique to tumor tissues (right). BCR clonotypes were classified into 5 categories, namely, hyper-expanded, large, medium, small, and single based on their corresponding clonotype size, and their sample-level compositions are shown in bar graphs. Patient number, smoking status, and tumor stage are annotated at the bottom. (E) BCR repertoire overlap across groups of cells with different antibody isotypes for LUAD (top right) and normal lung tissues (bottom left). Groups are ordered according to the genomic coordinates (5’ to 3’) of Ig subclass (i.e., IgG3, IgG1, IgA1, IgG2, IgG4 and IgA2) coding genes. Heatmap showing the fractions of BCR clonotypes belonging to an upstream isotype (each row) that are shared with a downstream isotype (columns). (F) Violin plot showing the distribution of BCR clonotype size across 12 B cell and PC states as defined in Figure 1E. (G) The same UMAP as in Figure 1E showing B cells and PCs with the 15 most expanded BCR clonotypes (same colors as in panel F). Cells with both scRNA-seq and scBCR-seq data were analyzed. (H) (left) A schematic illustration of BCR somatic hypermutation (SHM). (right) The same UMAP as in Figure 1E but cells are color-coded by levels of SHM in their corresponding BCRs. None, germline sequence with no detected SHM. Cells with both scRNA-seq and scBCR-seq data are shown. (I) Distribution of SHM frequencies across 12 B cell and PC subsets as defined in Figure 1E. (J) Box plot showing the distribution of BCR clonotypes size across 3 groups of cells with different SHM frequencies in their corresponding BCRs. (K) Box plot showing average SHM frequencies in tumor and normal tissues with spatially defined locations. P values were determined by paired t tests. (L) Alluvial plots showing the distribution of cells with different SHM frequencies across spatially defined locations, among all cells with productive BCRs based on scBCR-seq data (left) or among IgA+ or IgG+ cells only (right). Panels B and H were created with BioRender.com.
