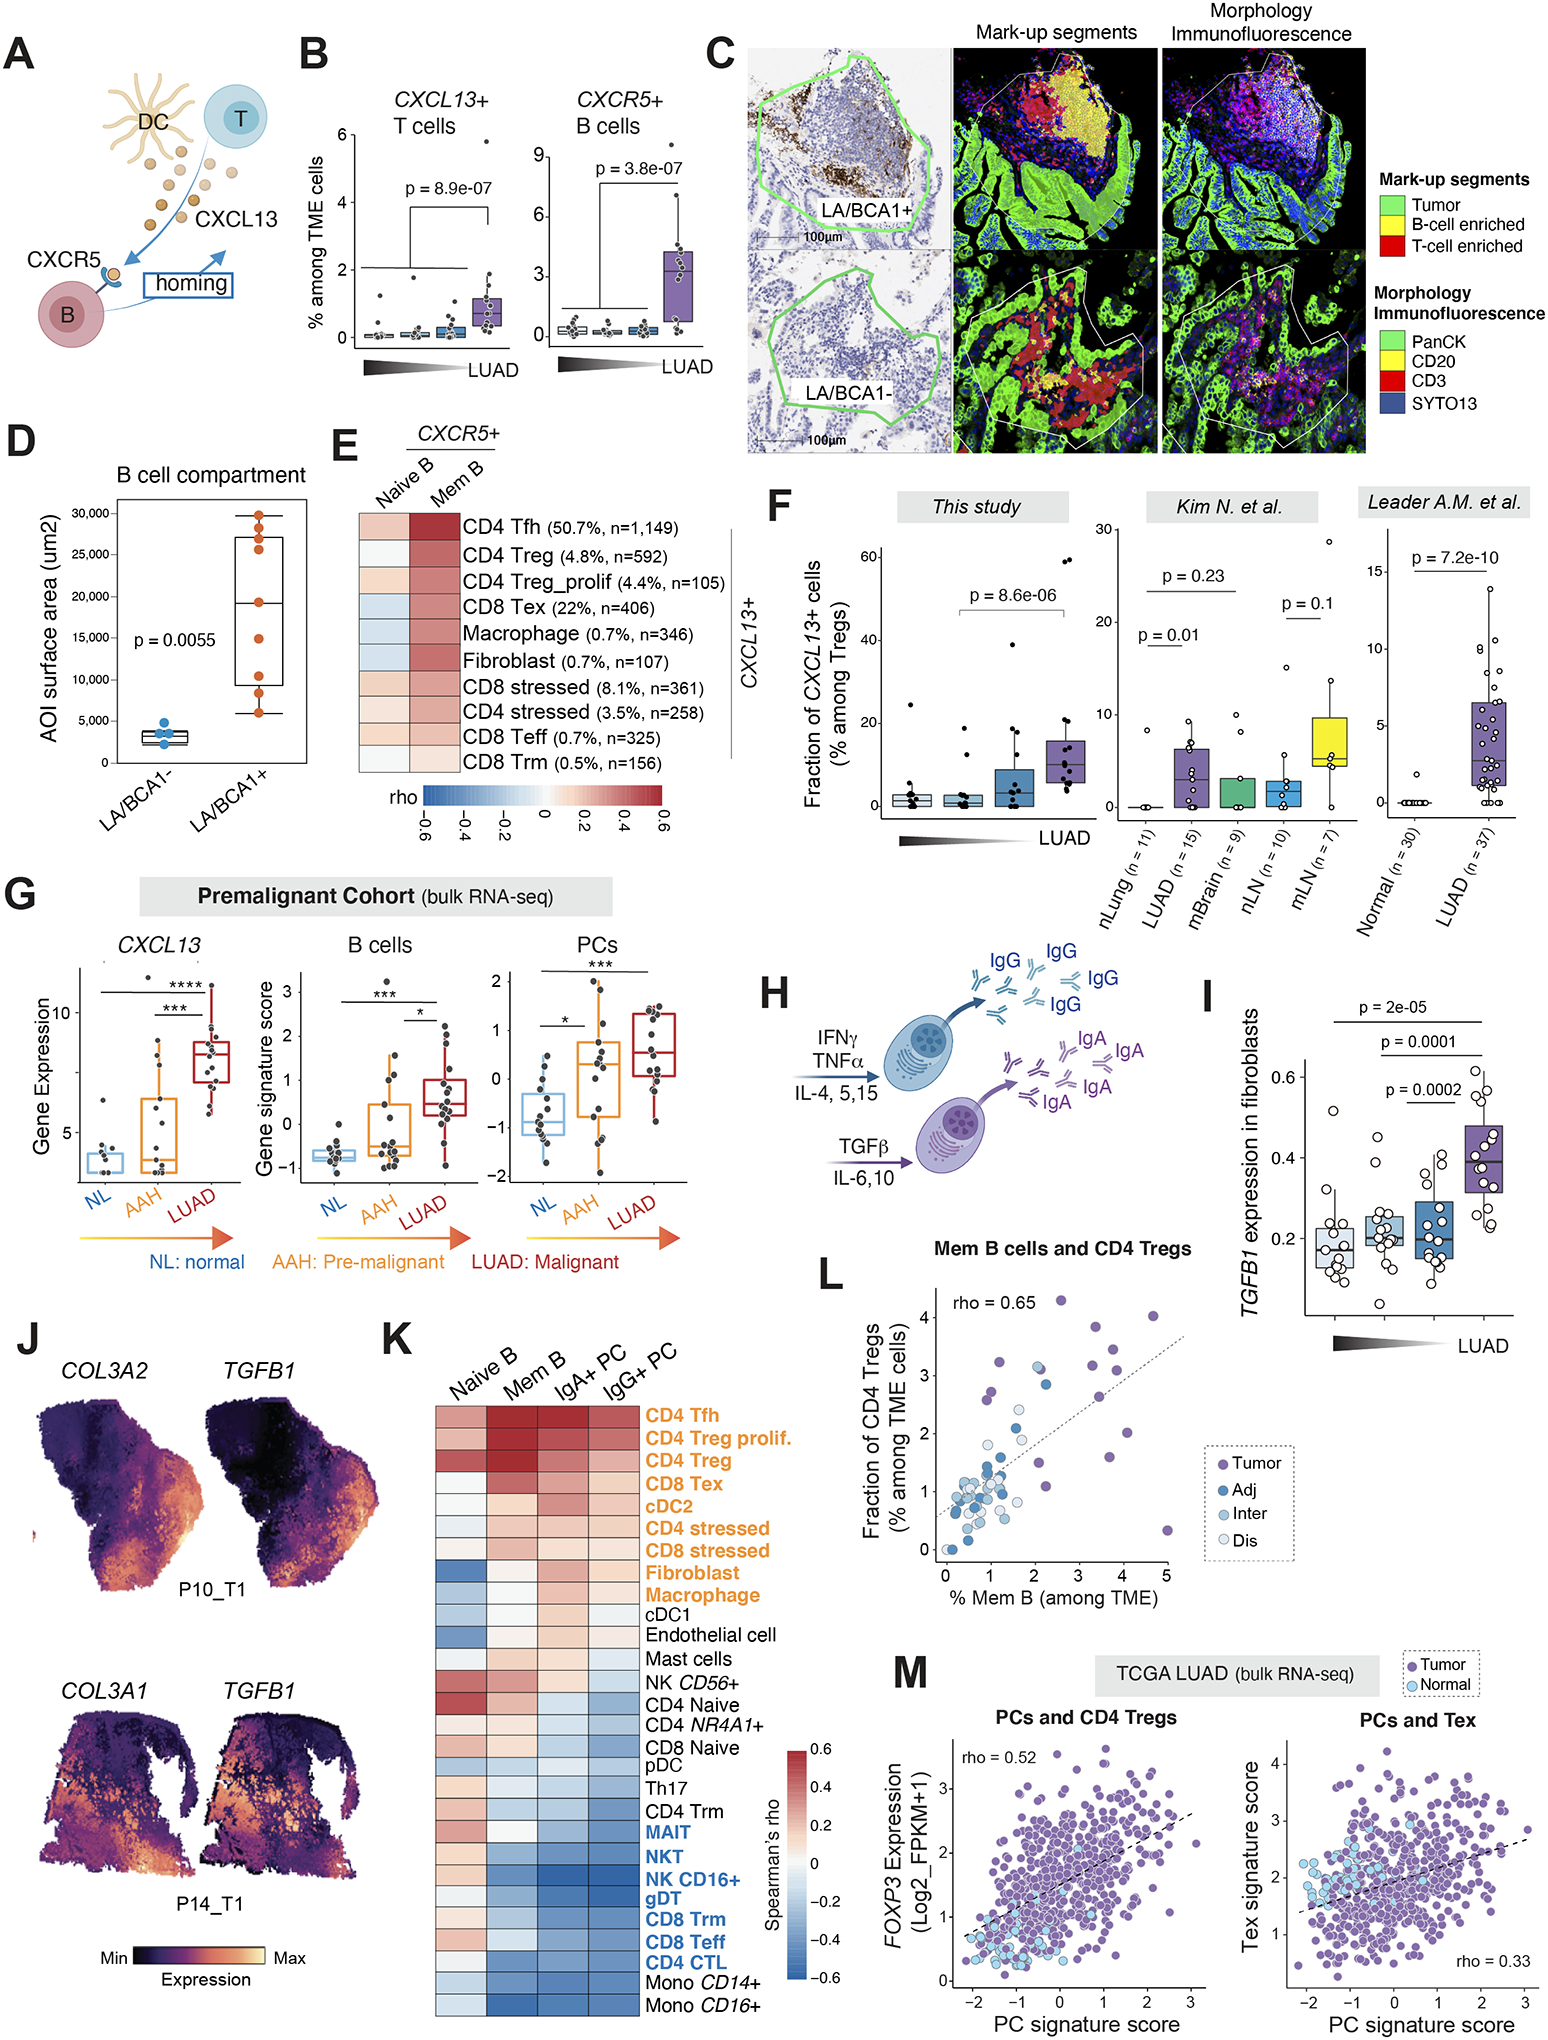
Figure 5. Interplay between TIBs and other TME cells in LUADs.

(A) A schematic illustration of B cell recruitment via the CXCL13-CXCR5 axis. (B) Fractions of CXCL13+ T cells and CXCR5+ B lineage cells, respectively, among all TME cells in LUADs and the multi-region normal lung tissues with spatially defined locations. (C) Representative DSP images showing AOI segmentation strategy. Each ROI was segmented into 3 AOIs: B cell, T cell or tumor cell-enriched based on expression of the morphology markers. ROI, region of interest; AOI, area of illumination. (D) Comparative analysis of B cell abundance between CXCL13 (BCA1)-positive and -negative lymphoid aggregates (LAs). B cell abundance in each ROI was quantified by measuring the AOI surface area of the B cell compartment. P value was calculated by the Wilcoxon test. (E) Co-occurrence relationships between CXCR5+ naïve and memory B cells and other CXCL13+ TME subsets identified using scRNA-seq. Spearman’s correlation analysis was used to statistically evaluate co-occurrence relationships of different TME cell subsets based on their corresponding cell fractions. A heatmap was plotted based on the Spearman’s correlation coefficient (rho). Ten other TME cell subsets with >100 cells or with a fraction of CXCL13-expressing cells > 0.5% were included in the heatmap. Mem, memory. Tfh, T follicular helper cells; Treg, regulatory T cells; Tex, exhausted T cells; Teff, effector T cells; Trm, resident memory T cells. (F) Fractions of CXCL13+ cells among Tregs in this study (left) and two public scRNA-seq datasets (middle and right). (G) Gene expression levels of CXCL13 and gene signature scores of B cells and PCs in a premalignant cohort with bulk RNA-seq data. P values were determined by the Mann-Whitney test. ***, P < 0.001; ****, P < 0.0001. (H) A schematic illustration of cytokines regulating PC isotype switching and antibody secretion. (I) Increased TGFB1 expression in tumor-associated fibroblasts. Wilcoxon test was used to calculate the p values. (J) Spatial transcriptomics (ST)-based mapping of TGFB1-expressing to fibroblast-enriched regions from 2 LUAD patients using the Visium platform (10X Genomics). (K) Co-occurrence relationships between 4 TIB subsets and 27 other TME cell populations identified using scRNA-seq. Spearman’s correlation analysis was used to statistically evaluate co-occurrence relationships of different TME cell subsets based on their corresponding cell fractions. Heatmap was plotted based on the Spearman’s correlation coefficient (rho). (L) Scatter plot displaying the correlation between the fractions of CD4 Tregs and that of memory B cells in the LUADs and normal lung tissues from all 16 patients in this scRNA-seq cohort. Spearman’s correlation independent of logarithmic transformation is shown. Samples are labelled by their spatial locations. (M) Scatter plots displaying the correlation between the gene signature scores of PCs and expression levels of the Treg marker gene, FOXP3 (top), or expression levels of the T cell exhaustion related gene signature (bottom), in samples from the TCGA LUAD cohort. Samples are labelled by their tissue types (tumor or normal). Tregs, regulatory T cells; Tex, exhausted T cells. Panels A and H were created with BioRender.com.
