
Figure 1. Average Percent Change of ED in Bystander Hospitals two years before and after closure.
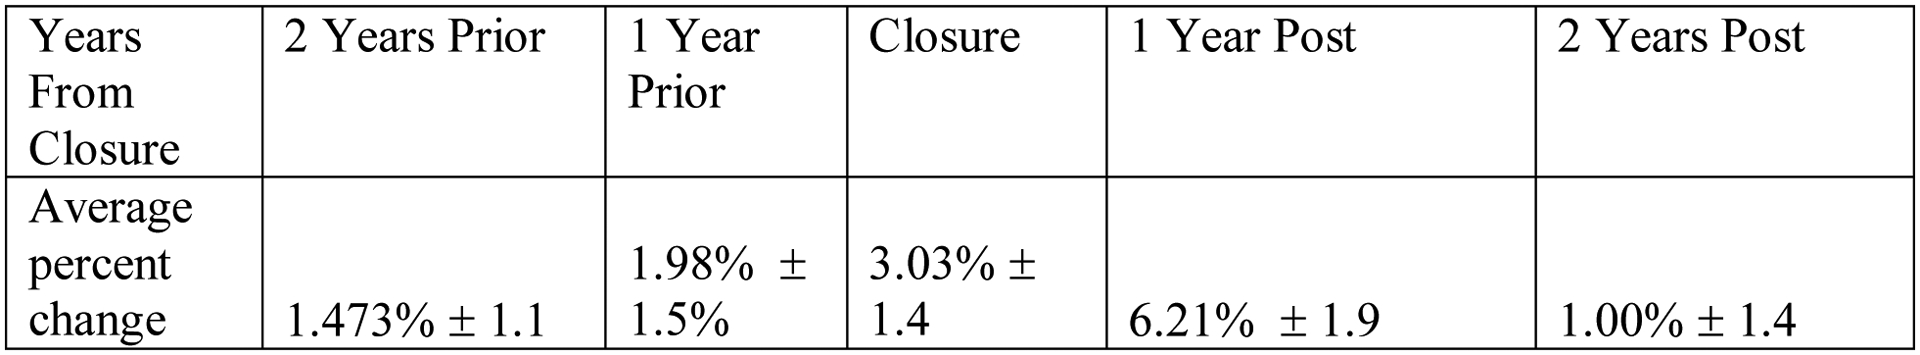
Figure 1 shows a five-year span with the two years preceding the hospital closure and two years afterwards along with the year of closure. Percentages shown represent the average percent-change in volume of emergency department visits for all of the bystander hospitals compared to the previous year.