
Fig. 2. hPSC differentiation to splanchnic mesoderm subtypes.
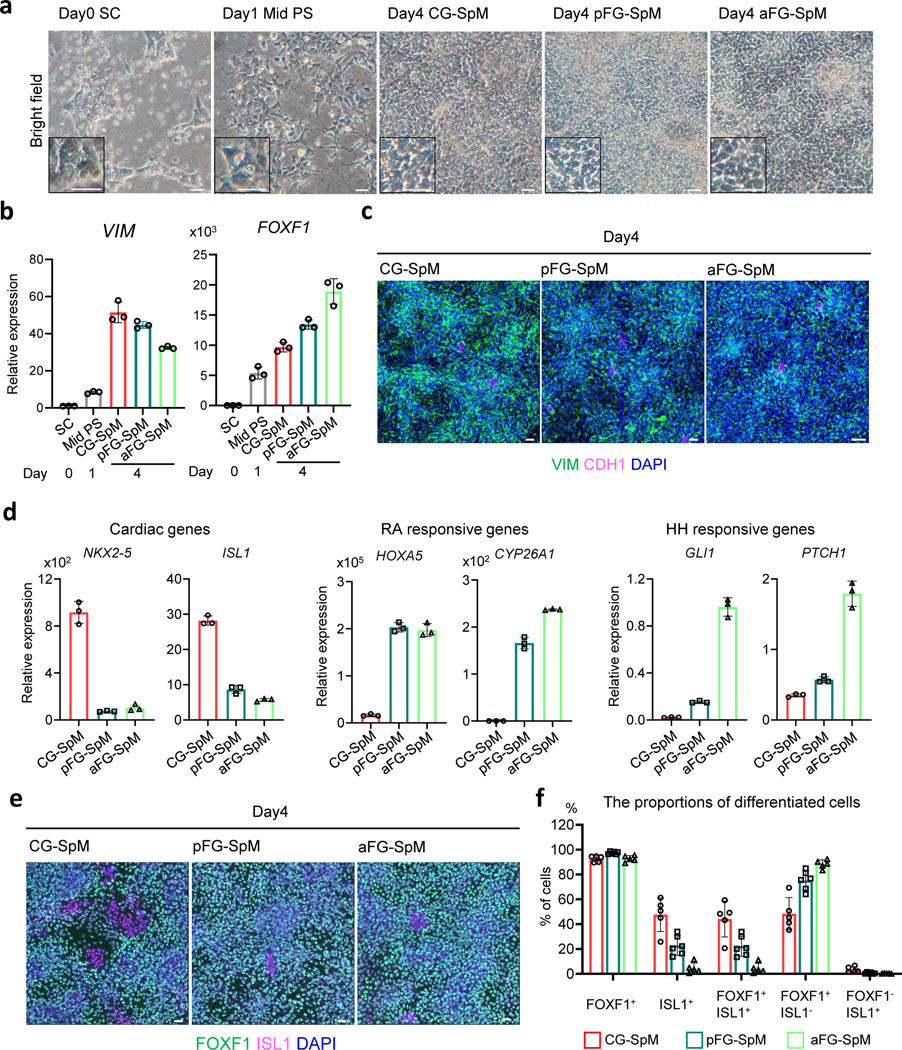
a, Bright field images of differentiating cells from hPSCs from day0 to day4. b, Relative mRNA expression of VIM and FOXF1 by qRT-PCR from day0 to day4. Each bar indicates the average from the 3 independent wells with standard deviation. c, Immunostaining for VIM (green), a pan mesoderm marker, and CDH1 (magenta), an epithelial marker at day 4. The images are maximum intensity projection of confocal stacks. d, Relative mRNA expression of cardiac genes (ISL1 and NKX2–5), RA-responsive genes (HOXA5 and CYP26A1) and HH-responsive genes (GLI1 and PTCH1) by qRT-PCR at day 4. Each bar indicates the average from the 3 independent wells with standard deviation. e, Immunostaining for FOXF1 (green), a splanchnic marker, and ISL1 (magenta), a cardiac mesoderm marker. The images are maximum intensity projection of confocal stacks. f, The average % proportion of differentiated cells positive for the indicated marker by immunocytochemistry. The numbers of marker positive cells were divided by the total number of DAPI positive cells. Mean with S.D. n=3 independent fields at day4. CG-SpM; cardiogenic splanchnic mesoderm, aFG-SpM; anterior foregut SpM, Mid. PS; middle region of primitive streak, pFG-SpM; posterior foregut SpM, SC; stem cell. Each column indicates the average from the 3 independent fields with standard deviation. Scale bar; 50μm