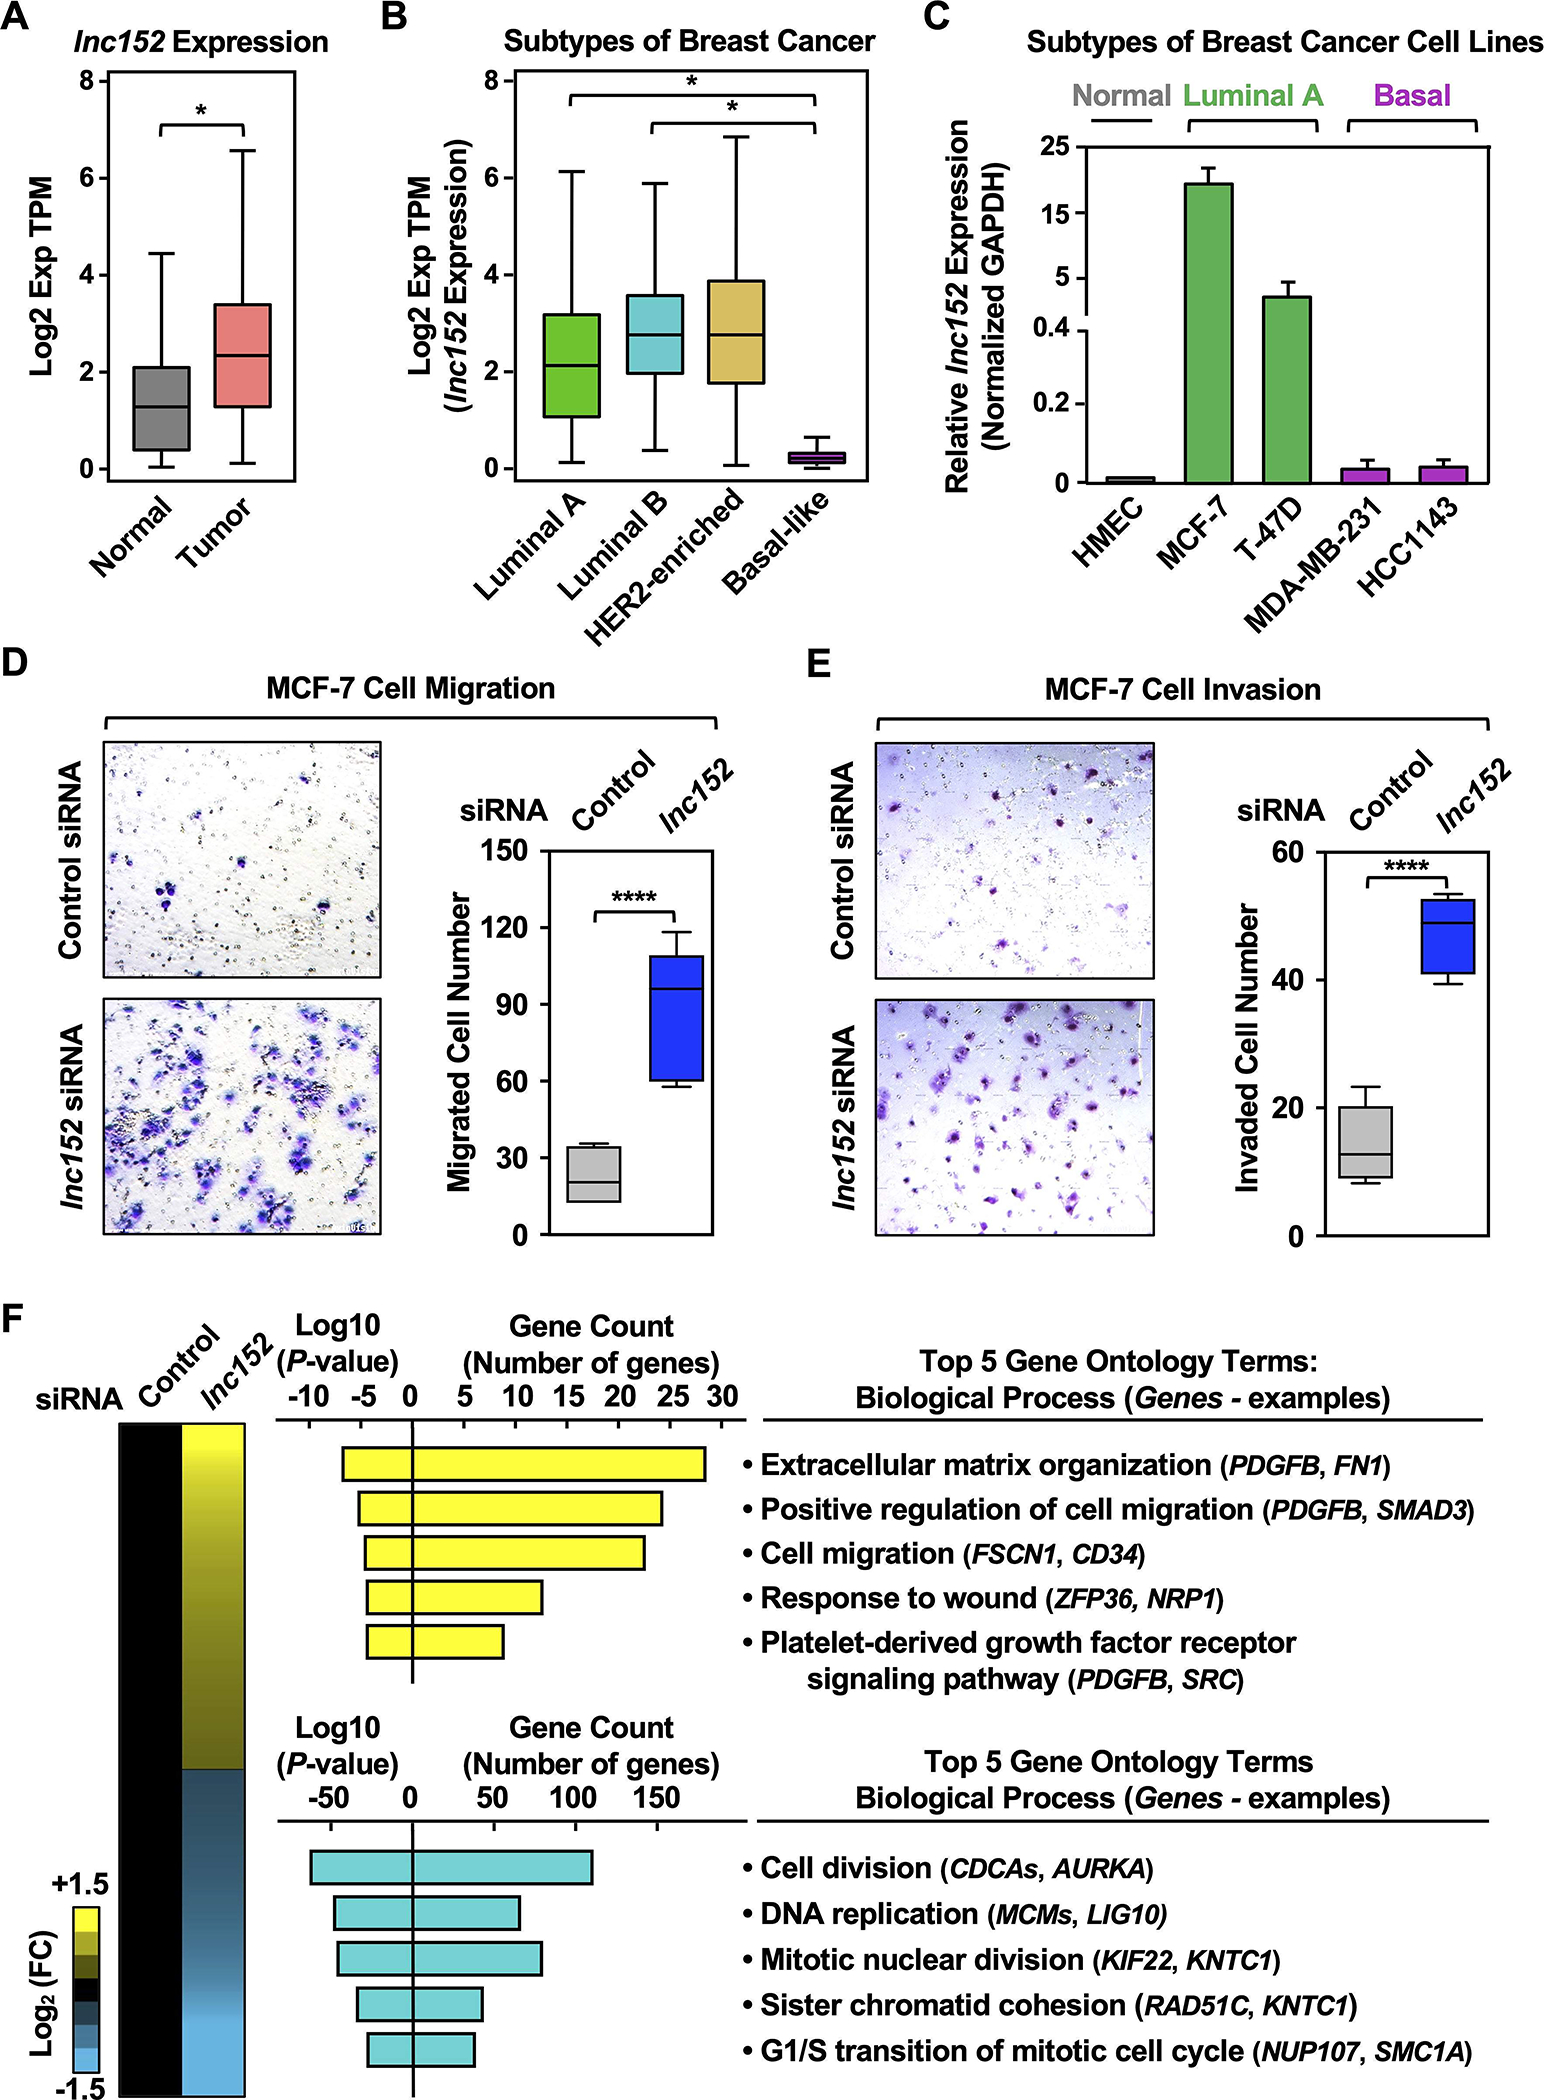
Figure 1. Lnc152 is differentially expressed across the distinct molecular subtypes of breast cancer and is required for suppression of luminal breast cancer cell invasiveness.

(A) RNA-seq expression data for lnc152 in primary tumors (TCGA breast cancer samples, n = 1085) compared to normal breast tissues (TCGA normal and GTEx data, n = 291). Bars marked with asterisks are statistically different from each other (two-tailed Student’s t test, * p < 0.05).
(B) Box plots comparing the expression of lnc152 in different molecular subtypes of breast cancer derived from patient samples [luminal A (n = 415), luminal B (n = 194), HER2-enriched (n = 66), and basal-like (n = 135); TCGA]. Bars marked with asterisks are statistically different from each other (two-tailed Student’s t test, * p < 0.05).
(C) Bar graphs showing the expression of lnc152 in breast cancer cell lines representing different molecular subtypes.
(D) (Left) siRNA-mediated knockdown of lnc152 promotes the cell migration of MCF-7 cells (luminal A breast cancer subtype) compared to knockdown with a control siRNA. (Right) Quantification of the results from the experiments shown in the left panel. Each box plot represents the mean ± SEM, n = 7. Bars marked with asterisks are statistically different from each other (two-tailed Student’s t test, **** p < 0.0001).
(E) (Left) siRNA-mediated knockdown of lnc152 promotes the cell invasion of MCF-7 cells (luminal A breast cancer subtype) compared to knockdown with a control siRNA. (Right) Quantification of the results from the experiments shown in the left panel. Each box plot represents the mean ± SEM, n = 6. Bars marked with asterisks are statistically different from each other (two-tailed Student’s t test, **** p < 0.0001).
(F) siRNA-mediated knockdown of lnc152 alters gene expression in MCF-7 cells. (Left) Heatmap showing the results of RNA-seq assays from lnc152-depleted MCF-7 cells. (Middle) Gene ontology analysis showing biological processes that are enriched (yellow) and those that are de-enriched (cyan). (Right) GO terms in each cluster indicating the top five biological processes determined by REViGO analysis. Genes of interest are listed in each GO term.
