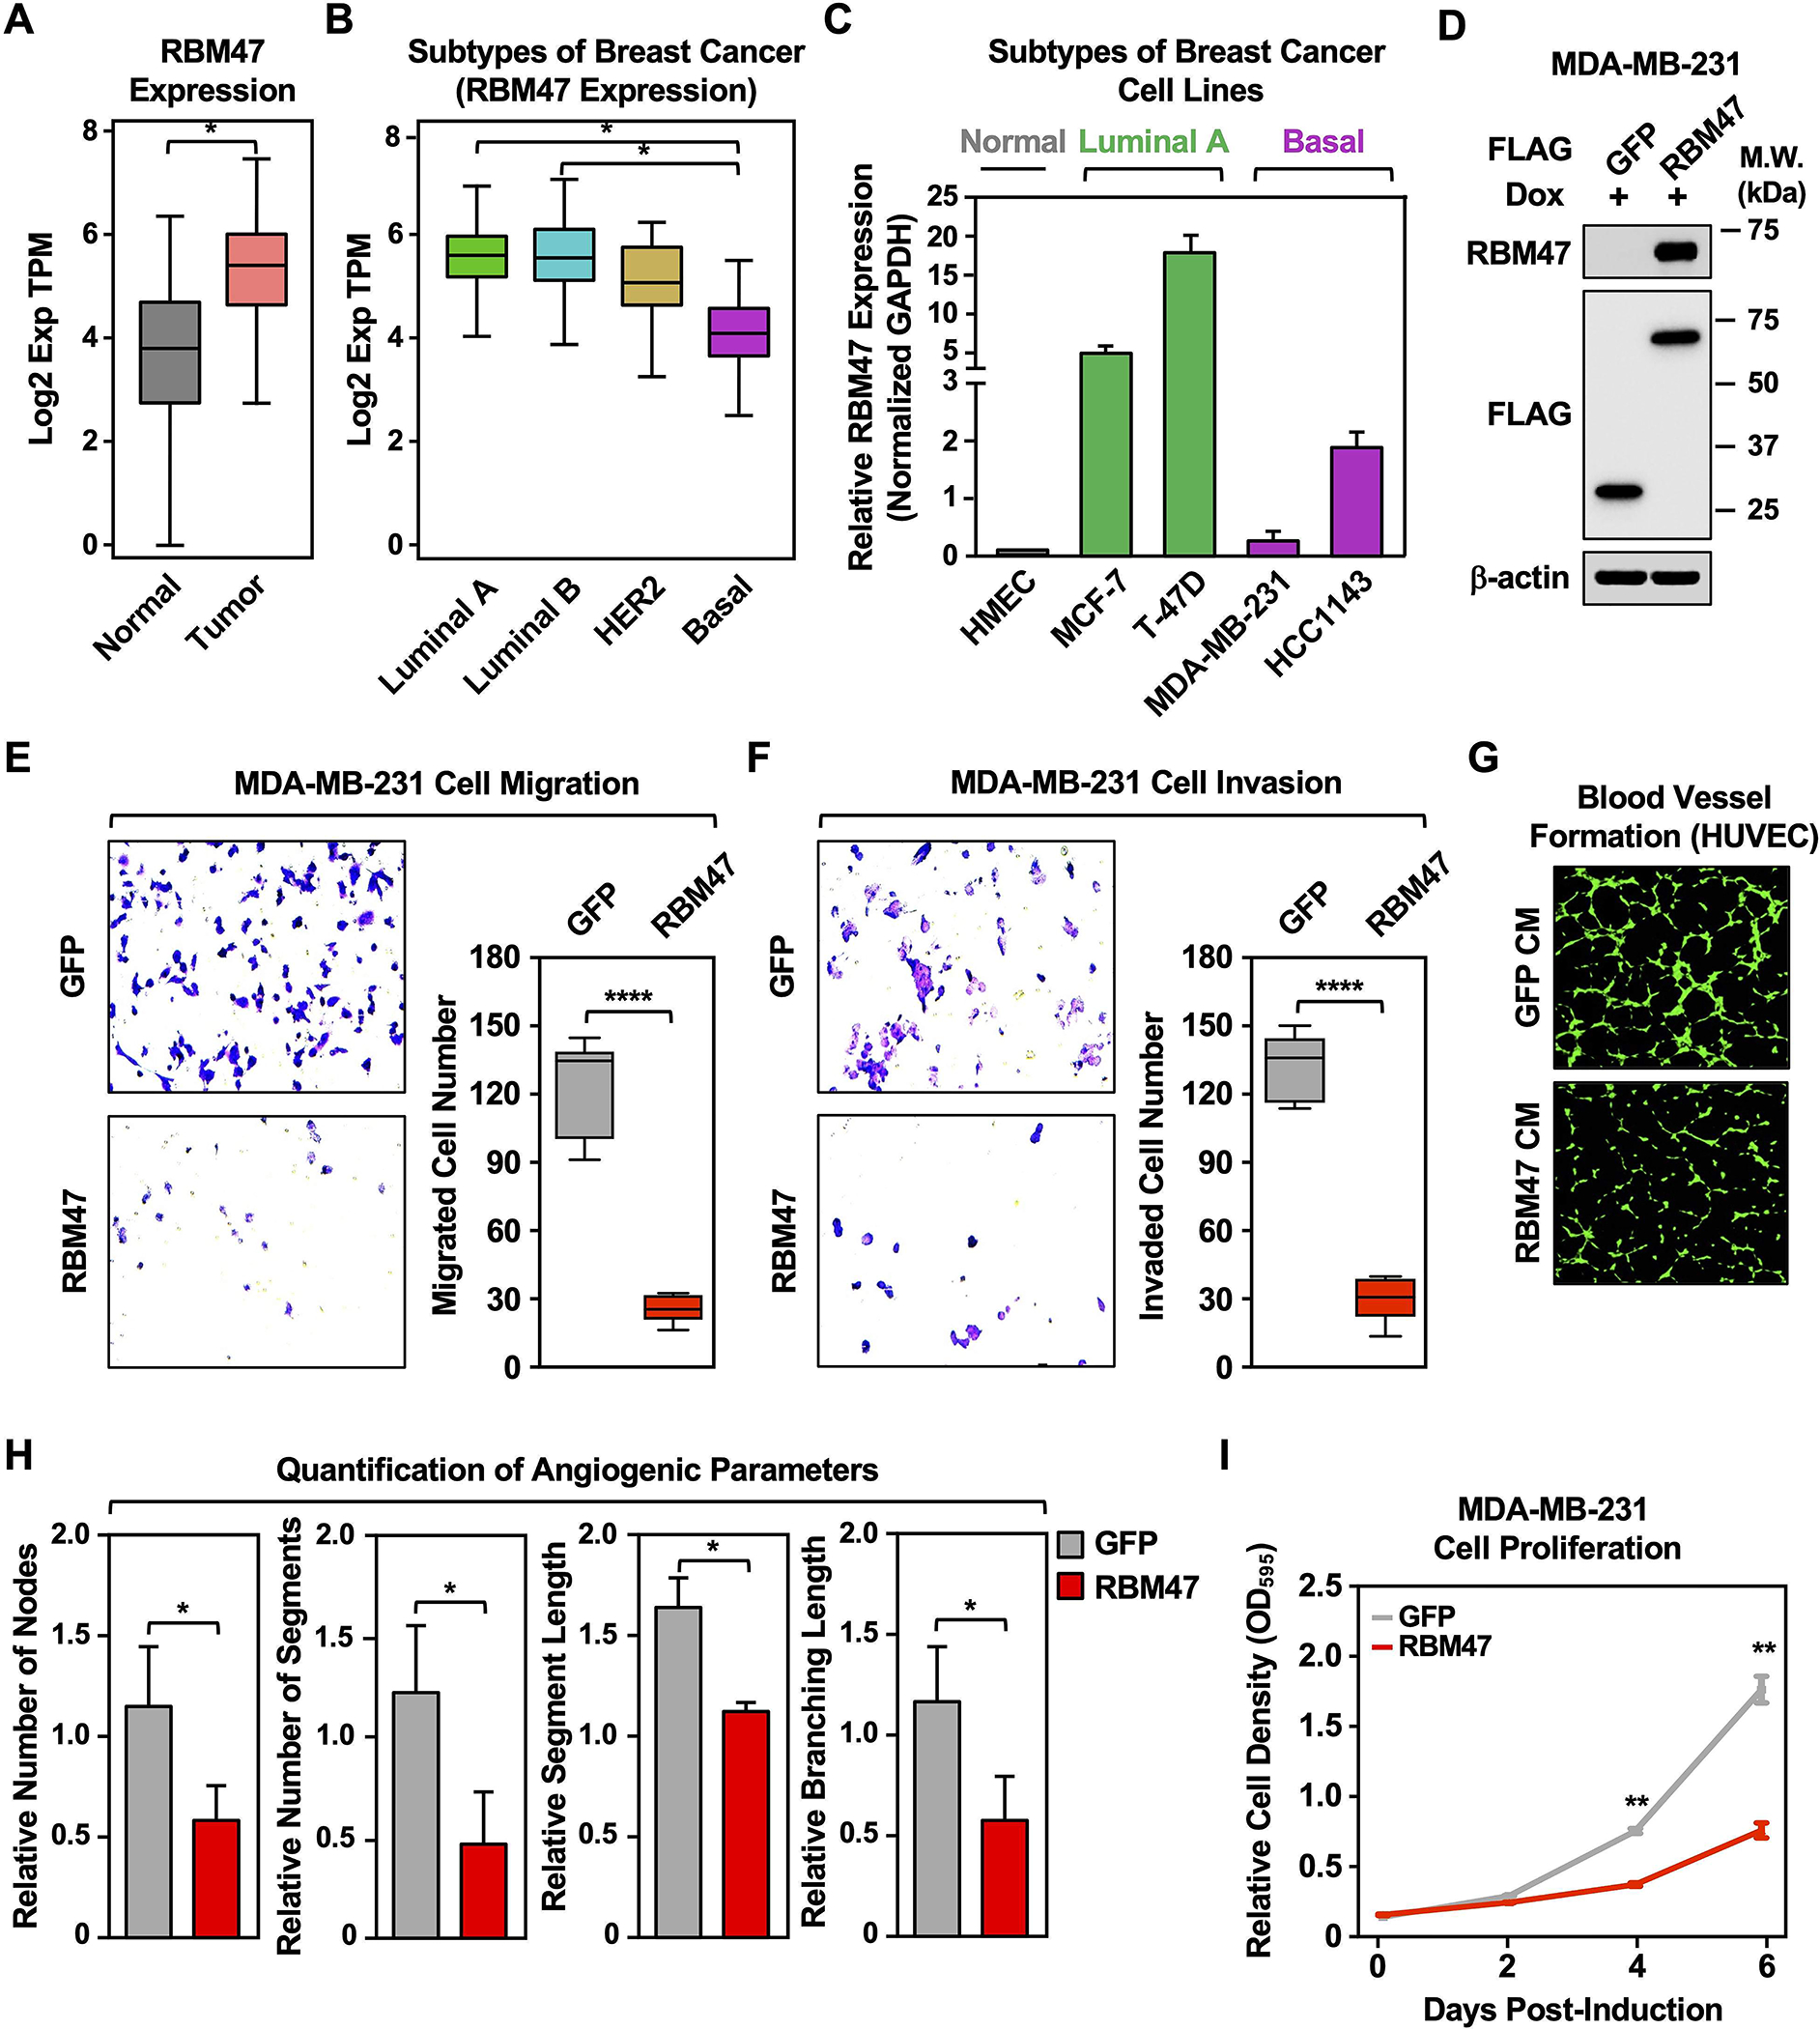
Figure 6. Ectopic expression of RBM47 inhibits aggressive cancer-related outcomes in MDA-MB-231 TNBC cells.

(A) RNA-seq expression data for RBM47 in primary tumors (TCGA breast cancer samples, n = 1085) compared with normal breast tissues (TCGA normal and GTEx data, n = 291). Bars marked with asterisks are statistically different from each other (two-tailed Student’s t test, * p < 0.05).
(B) Box plots comparing the expression of RBM47 in different intrinsic molecular subtypes of breast cancers derived from patient samples [luminal A (n = 415), luminal B (n = 194), HER2-enriched (n = 66), and basal-like (n = 135); TCGA]. Bars marked with asterisks are statistically different from each other (two-tailed Student’s t test, * p < 0.05).
(C) Bar graph showing the expression of RBM47 in breast cancer cell lines representing different molecular subtypes.
(D) Generation of MDA-MB-231 cell lines for Dox-inducible ectopic expression of FLAG-GFP or FLAG-RBM47. Whole cell extracts were analyzed by Western blotting for RBM47, FLAG, and β-actin. Comparable protein expression of GFP and RBM47 levels are shown in the Western blots for FLAG.
(E) (Left) Dox-induced ectopic expression of RBM47 inhibits the migration of MDA-MB-231 cells compared to ectopic expression of GFP mRNA. (Right) Quantification of the results from the experiments shown in the left panel. Each bar represents the mean ± SEM, n = 6. Bars marked with asterisks are statistically different from each other (two-tailed Student’s t test, **** p < 0.0001).
(F) (Left) Dox-induced ectopic expression of RBM47 inhibits the invasion of MDA-MB-231 cells compared to ectopic expression of GFP mRNA. (Right) Quantification of the results from the experiments shown in the left panel. Each bar represents the mean ± SEM, n = 5. Bars marked with asterisks are statistically different from each other (two-tailed Student’s t test, **** p < 0.0001).
(G) Dox-induced ectopic expression of RBM47 prevents human umbilical vein endothelial cell (HUVEC) tube formation on Matrigel. Morphological appearance of HUVECs grown on Matrigel with conditioned medium collected from MDA-MB-231 cells expressing Dox-induced GFP or RBM47, stained with Calcein-AM (green) and detected by fluorescence microscopy.
(H) Quantification of the results from the experiments shown in panel G. Image J software with the Angiogenesis plugin was used to detect the number of nodes, number of segments, segment length, and branching length. Each bar represents the mean + SEM, n = 4. Bars marked with asterisks are statistically different from each other (two-tailed Student’s t test, * p < 0.05).
(I) Dox-induced ectopic expression of RBM47 inhibits MDA-MB-231 cell proliferation more effectively than ectopic expression of GFP. Cells were treated daily with 1 μg/mL of Dox for six days. Each point represents the mean ± SEM, n = 3. Points marked with asterisks are statistically different from each other (two-tailed Student’s t-test, ** p < 0.01).
