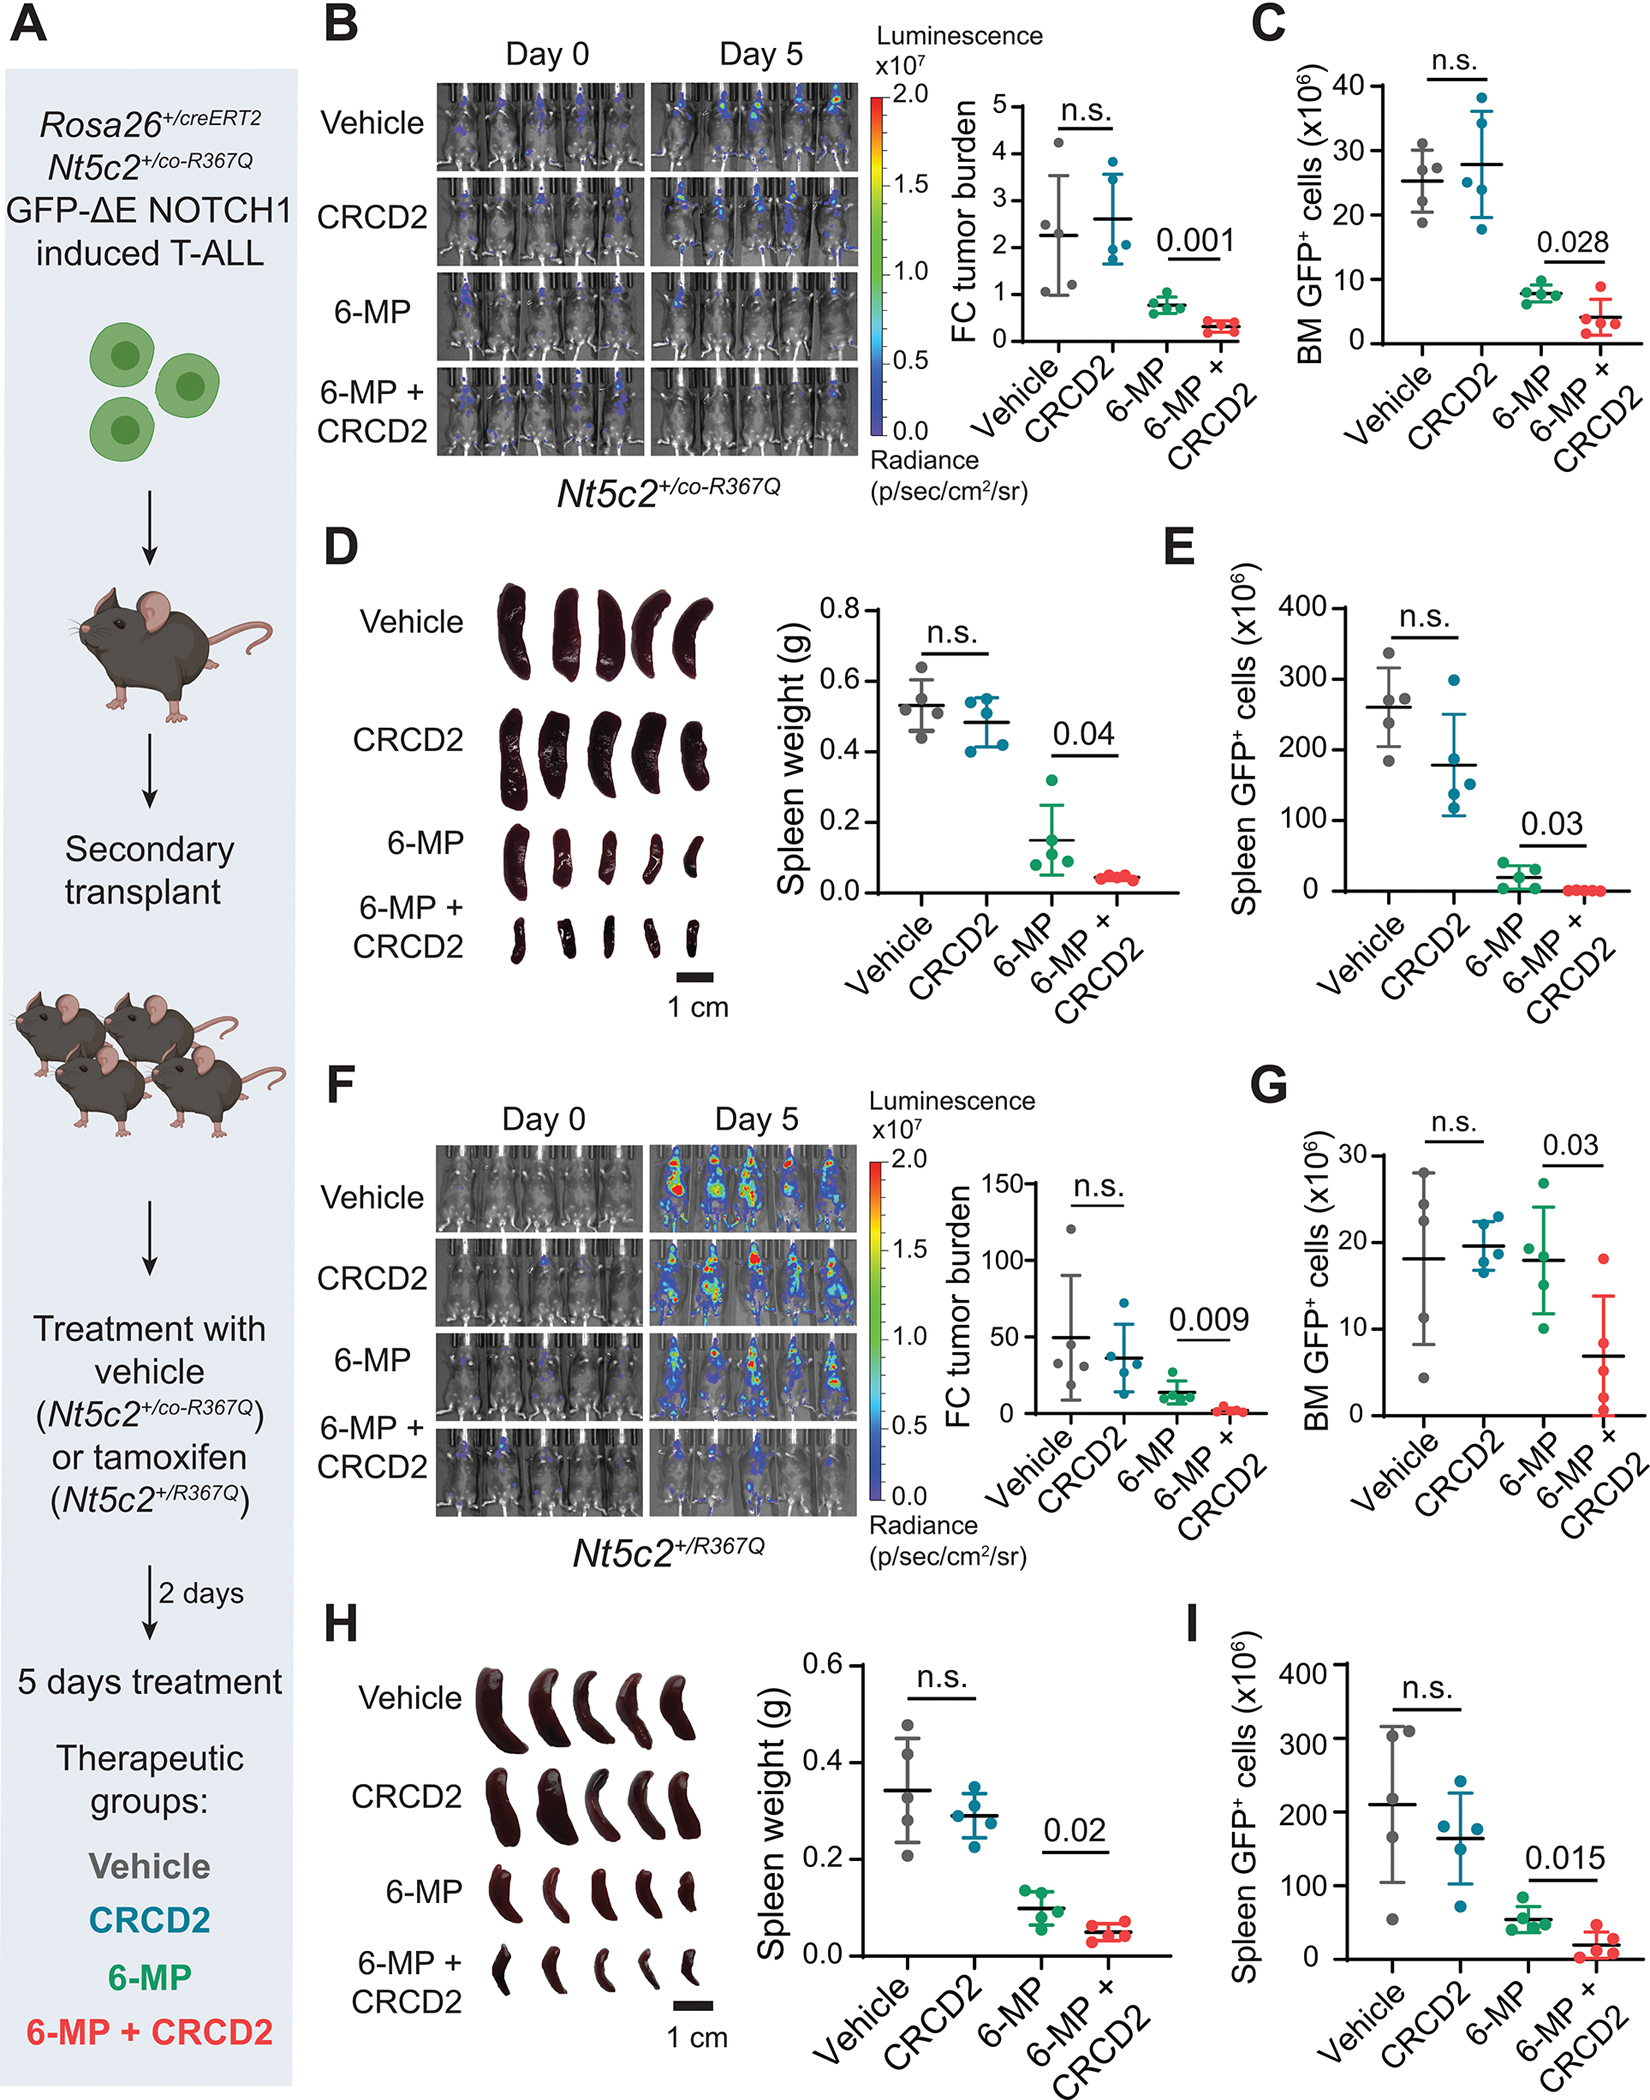
Figure 5. Response of NT5C2 wild type and R367Q tumors to CRCD2 and 6-MP combinatorial chemotherapy in vivo.

(A) Schematic illustration of 6-MP and CRCD2 combination experimental therapeutic treatment in Nt5c2+/co-R367Q (wild type) and Nt5c2+/R367Q (mutant) NOTCH1- induced ALL mouse model. (B) Luciferase in vivo bioimaging indicative of tumor burden and quantitative analysis of tumor response (fold change in bioluminescence relative to the basal signal before treatment) in Nt5c2 wild-type ALL tumors treated with vehicle, single-drug or 6-MP and CRCD2 combination. (C) Femoral bone marrow leukemia burden (GFP+ cells) analyzed by flow cytometry following treatment of wild type leukemias as in (A). (D) Images of spleens and quantitation of spleen weight following treatment of wild type leukemias as in (A). (E) Spleen leukemia burden (GFP+ cells) analyzed by flow cytometry following treatment of wild type leukemias as in (A). (F) Luciferase in vivo bioimaging indicative of tumor burden and quantitative analysis of tumor response (fold change in bioluminescence relative to the basal signal before treatment) in Nt5c2 R367Q ALL tumors treated with vehicle, single-drug or 6-MP and CRCD2 combination as in (A). (G) Femoral bone marrow leukemia burden (GFP+ cells) analyzed by flow cytometry following treatment of Nt5c2 R367Q ALL bearing mice as in (A). (H) Images of spleens and quantitation of spleen weight following treatment of in Nt5c2 R367Q ALL tumors as in (A). (I) Spleen leukemia burden (GFP+ cells) analyzed by flow cytometry following treatment of wild type leukemias as in (A). N = 5 independent mice per treatment condition. Data are presented as mean values ± SD. P values were calculated applying two-sided Student’s t-test.
