
Figure 6. Molecular and structural characterization of NT5C2 phosphorylation at Ser502.
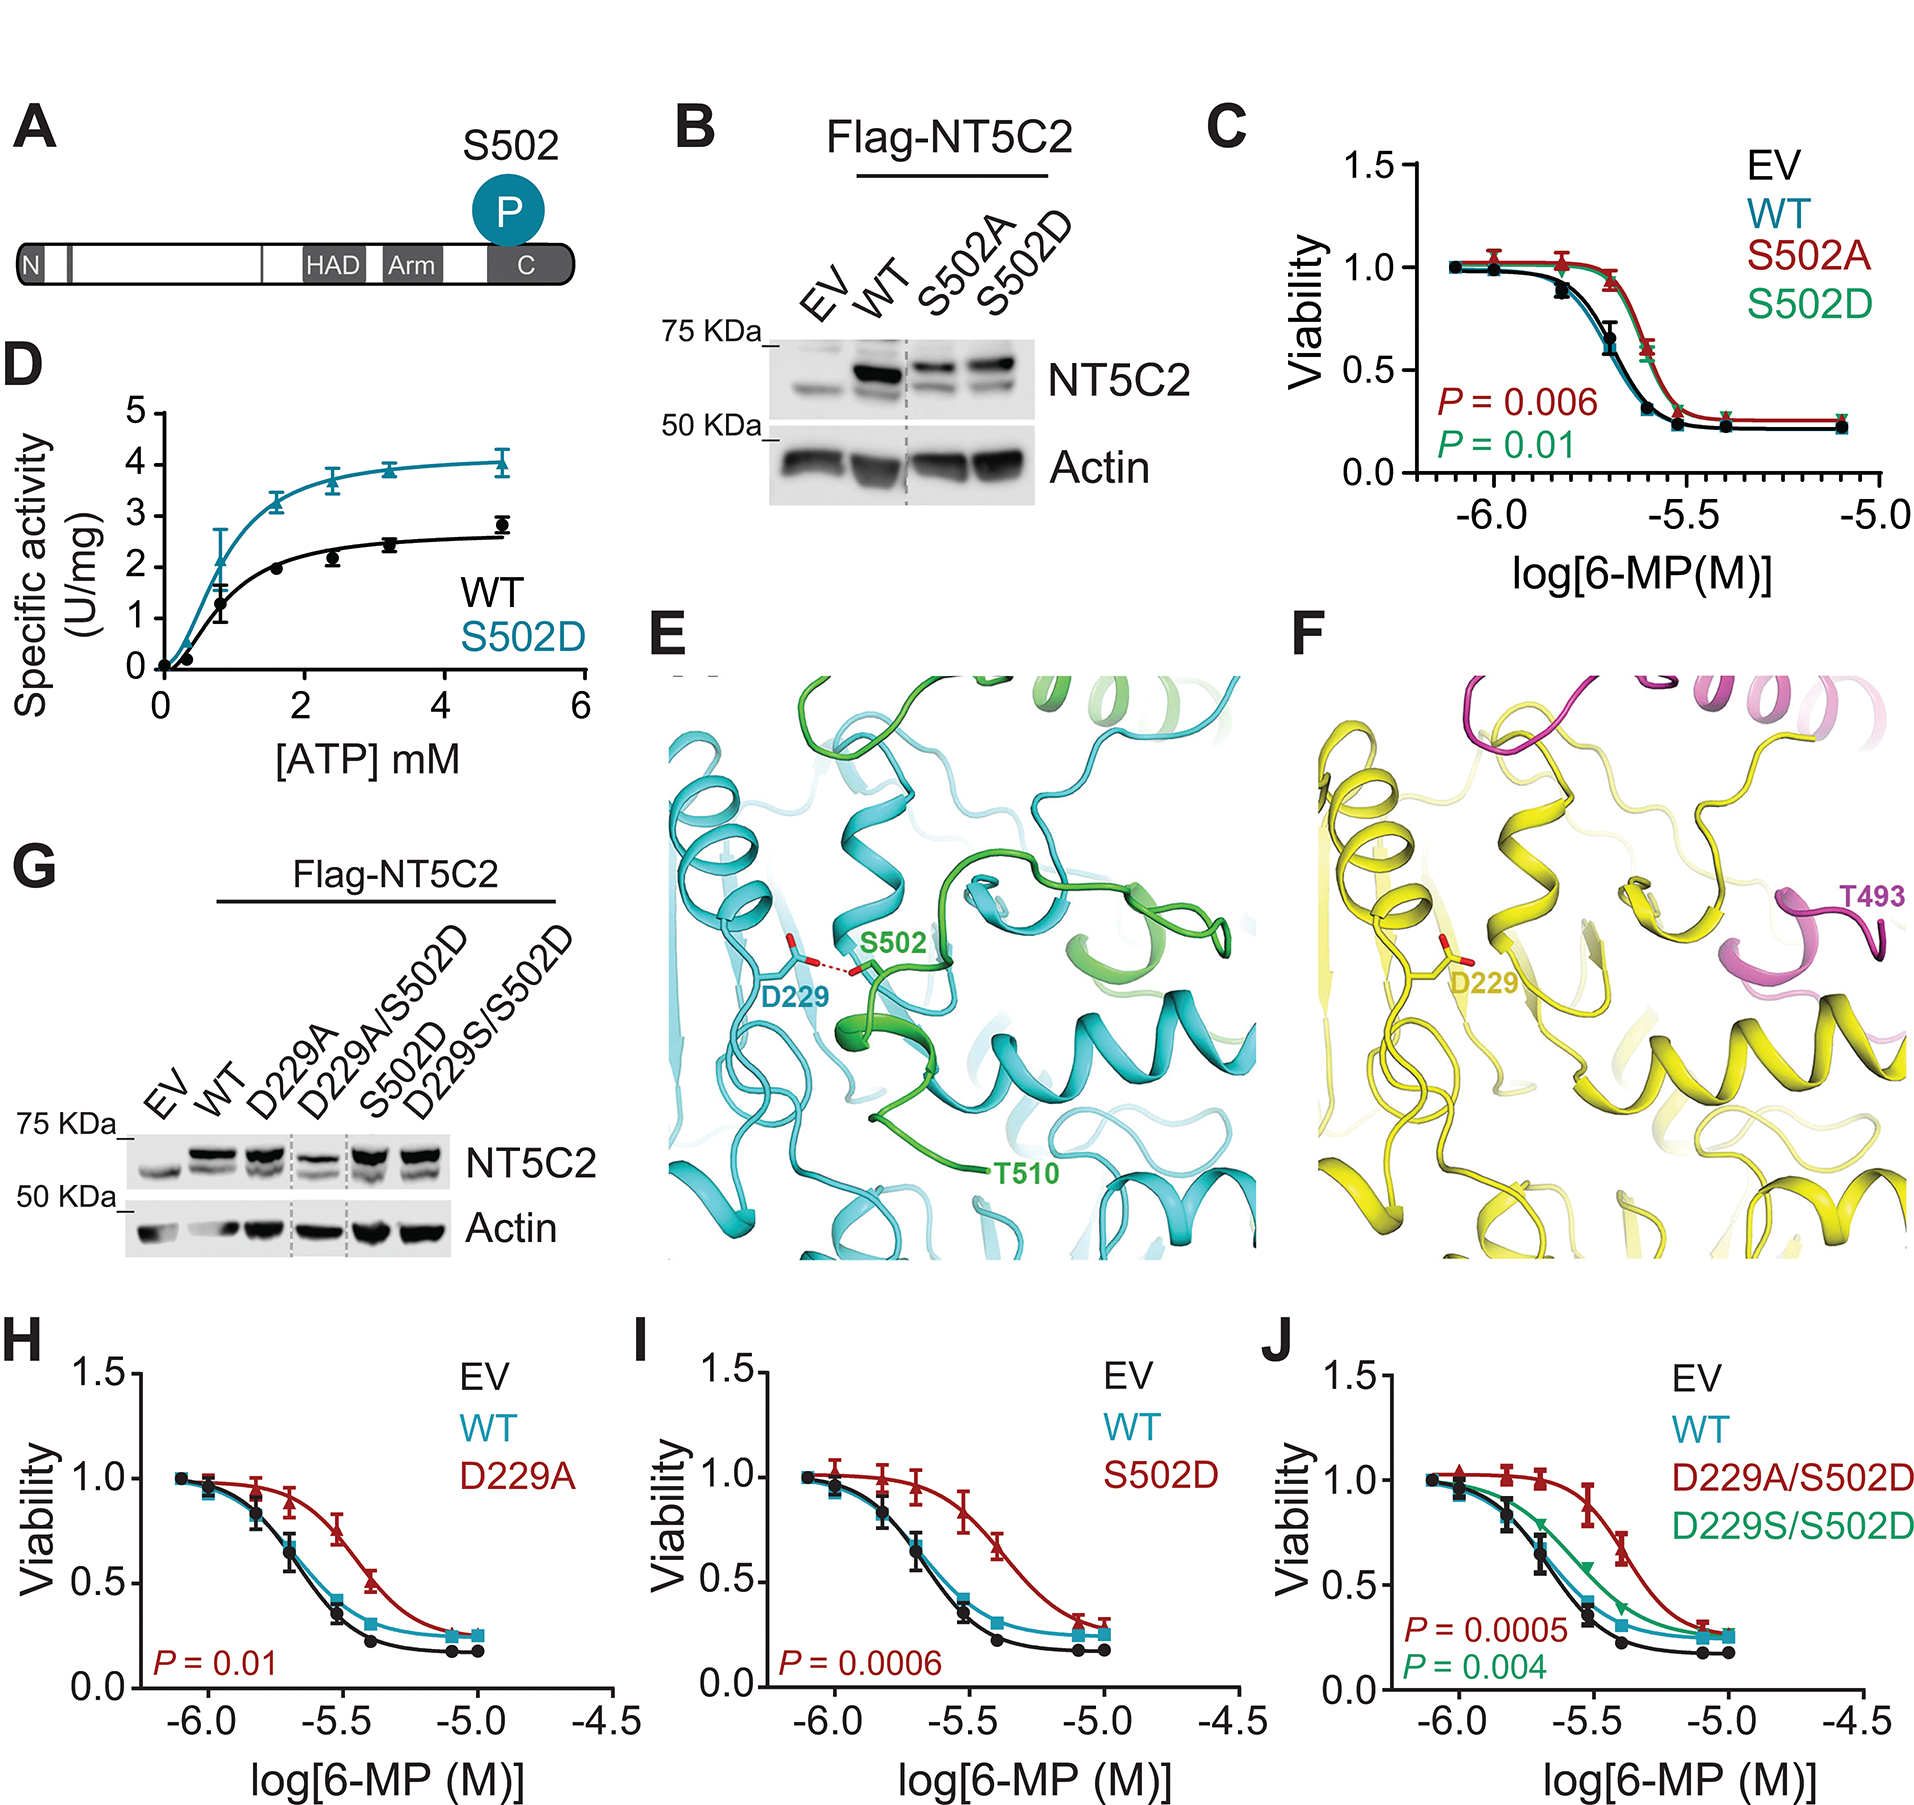
(A) Schematic illustration of Ser502 phosphorylation at the C-terminal domain of NT5C2. (B) Immunoblot analysis of Jurkat cells infected with empty vector or lentiviruses driving the expression of Flag-tagged Ser502 mutants of NT5C2. Expression levels were verified in three independent experiments. (C) Viability assay of Jurkat cells infected with mutant Ser502 NT5C2 expressing lentiviruses treated with increasing doses of 6-MP. (D) In vitro nucleotidase assays assessing the enzymatic activity of wild-type and S502D NT5C2 using increasing concentrations of ATP represented as specific activity. (E) Close-up view of the crystal structure of full-length wild-type NT5C2 (PDB id: 6DDO) showing residue S502 (green) from protomer A forms a hydrogen bond (red dash line) with D229 from protomer B (cyan). (F) Close-up view of the crystal structure of the full-length NT5C2 mutant S502D showing that mutation of S502 to D results in destabilization of C-terminal region (494–561). Protomers A and B are shown in magenta and yellow, respectively. (G) Immunoblot analysis of Jurkat cells infected with empty vector or lentiviruses driving the expression of Flag-tagged Asp-229 and Ser502 mutants of NT5C2. Expression levels were verified in three independent experiments. (H) Viability assay of Jurkat cells infected with mutant D229A NT5C2 expressing lentiviruses treated with increasing doses of 6-MP. (I) Viability assay of Jurkat cells infected with mutant S502D NT5C2 expressing lentiviruses treated with increasing doses of 6-MP. (J) Viability assay of Jurkat cells infected with double Asp-229 and Ser502 mutants expressing lentiviruses treated with increasing doses of 6-MP. All graphs show mean ± SD of three independent experiments performed in triplicate. P values were calculated using IC50 values and two-tailed Student’s t-test over wild-type.