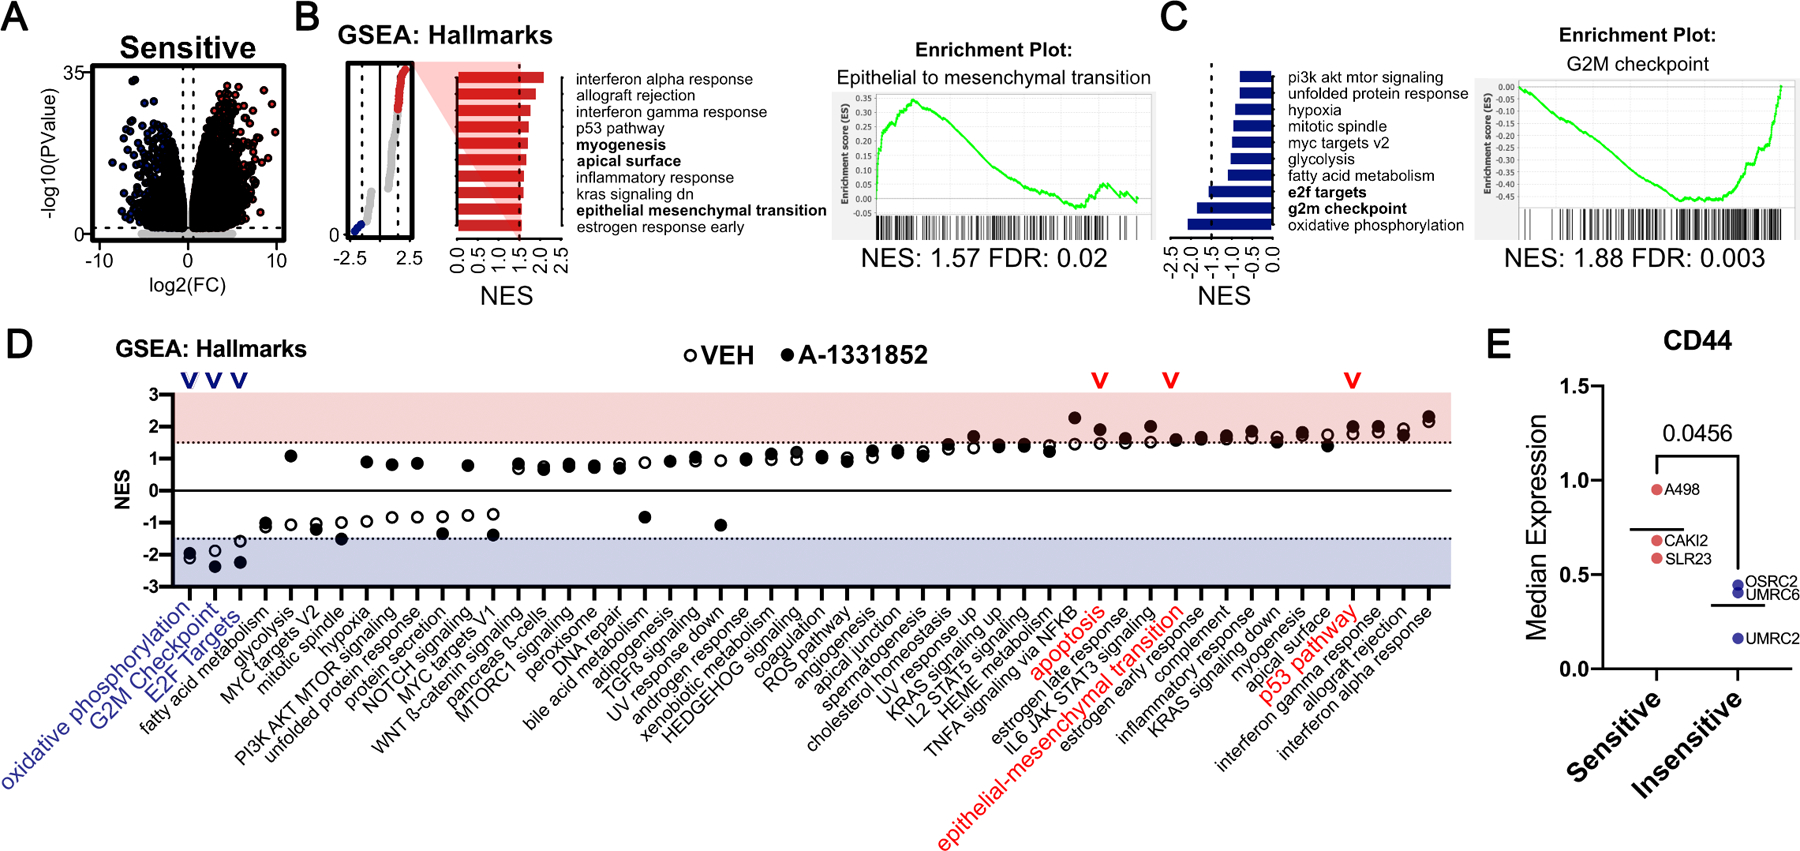
FIGURE 3.

Transcriptomics Analysis Identifies Correlates Associated with BCL-XL Dependency. A, Volcano plot of genes that were identified as differentially expressed (bottom, ≥ 1.5-fold and FDR ≤ 10%, as determined by RNA-Seq) in BCL-XL inhibitor ‘Sensitive’ (S) versus ‘Insensitive’ (I), under untreated basal conditions. Gene-sets that were enriched in Sensitive (B) or enriched in Insensitive (C) ccRCC cells (NES ≥ 1.5 and FDR ≤ 10%), under untreated conditions with representative plots of the indicated gene sets. D, Lollipop plot depicting results of GSEA (NES ≥ 1.5 and FDR ≤ 10%) comparing RNA-Seq data from S vs I cells that were either untreated (open circles) or A-1331852 treated (filled circles) ccRCC cells. Arrowheads mark key differential gene sets. E, CD44 levels, as determined by flow cytometry, in the indicated BCL-XL inhibitor Sensitive and Insensitive cell lines.
