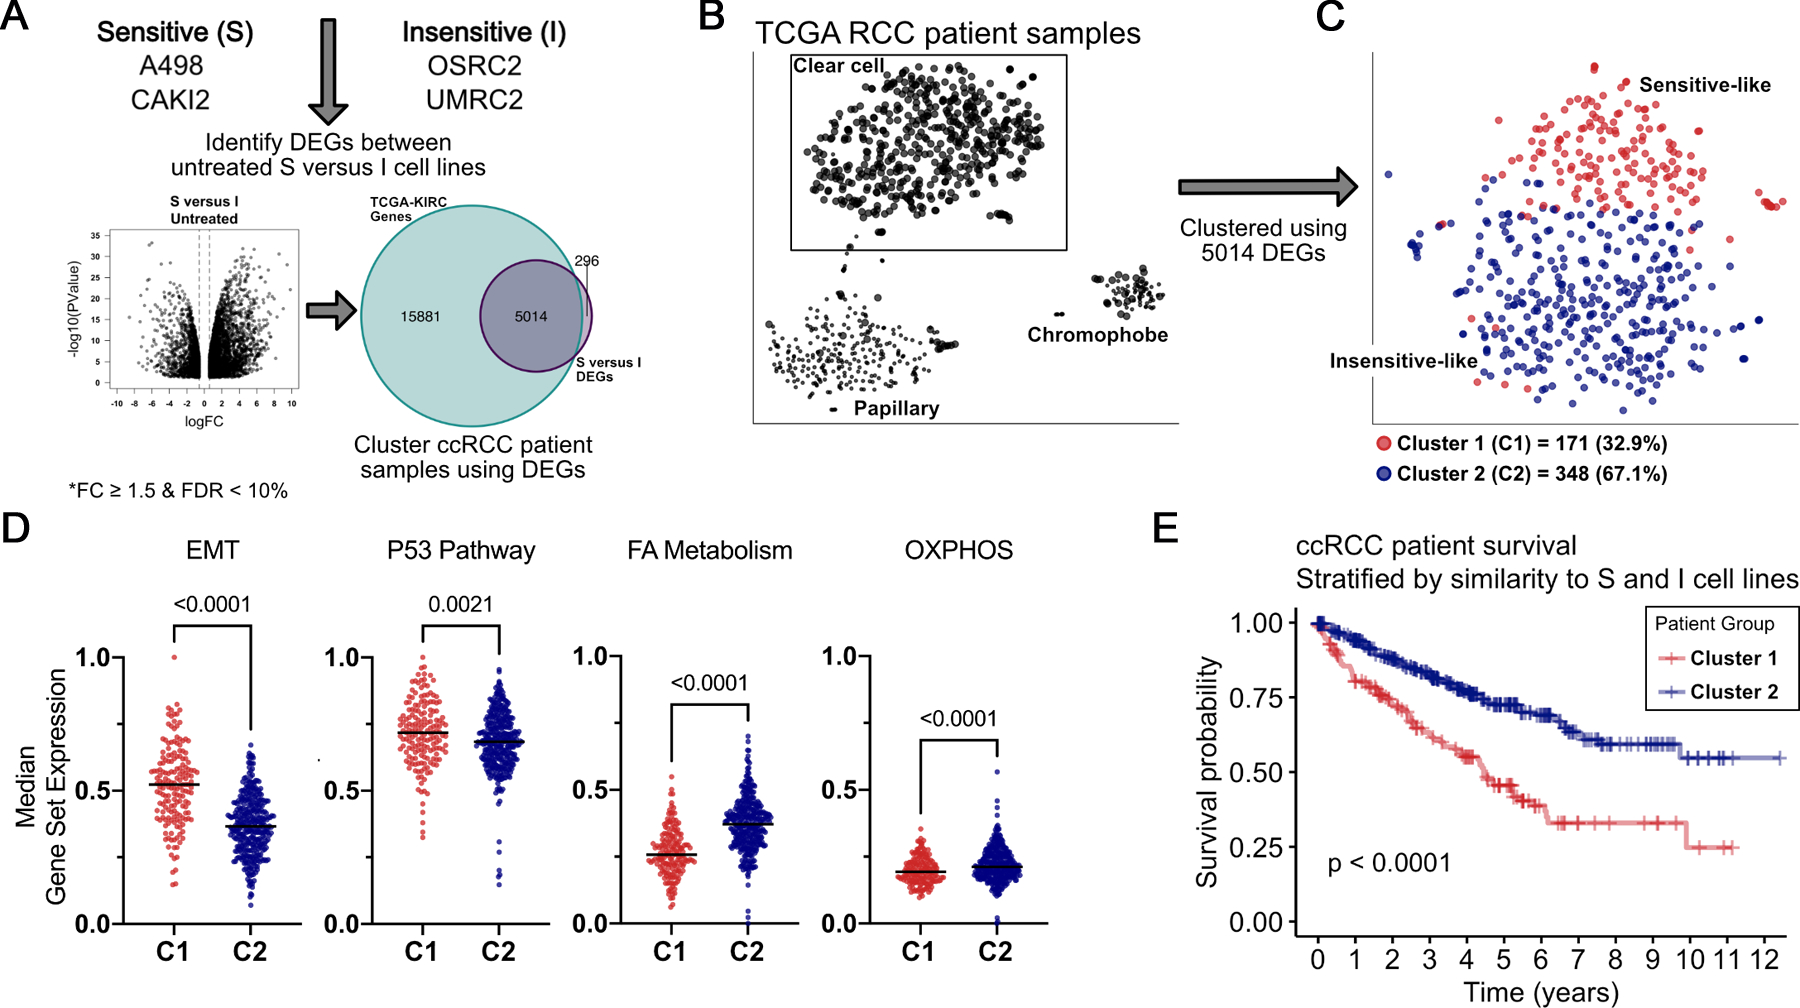
FIGURE 5.

BCL-XL Dependency Signatures are Evident in ccRCC Clinical Specimens. A, Schema indicating the computational overlay of differentially-expressed genes, as determined in 4A, onto renal cancer gene expression data mined from TCGA. B, Principle-component analysis showing segregation of tumors based on their subtype (left), and then within ccRCC (C) by similarity in gene signature to Sensitive (red) versus insensitive (blue) lines (right). Median gene expression levels of the indicated gene sets (D) and Kaplan-Meier curves depicting clinical outcomes (E) in patients with tumors resembling the BCL-XL inhibitor Sensitive versus Insensitive cell lines. (A) and (D) were compared using the Student’s t test. In (E) Sensitive (n = 171) and Insensitive (n = 348) patients were compared by the log-rank test.
