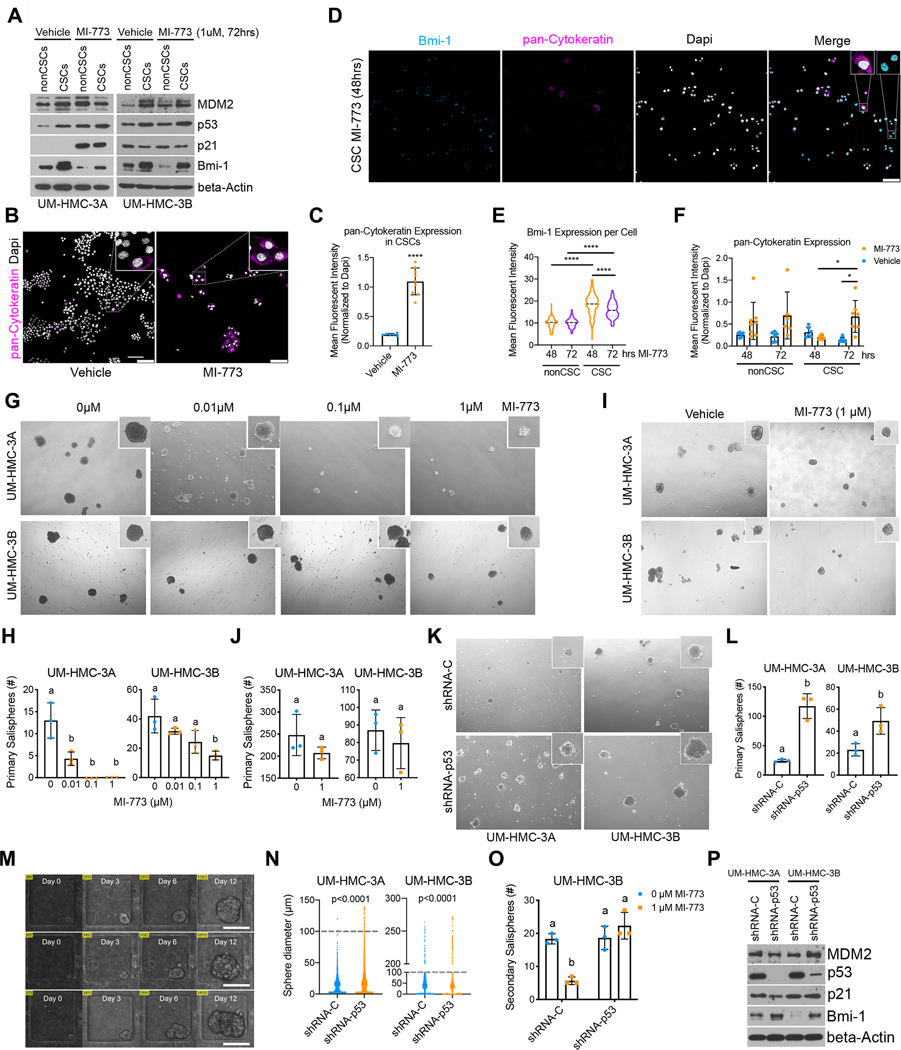
Figure 5: p53 activation blocks self-renewal and induces differentiation of cancer stem cells.
A-C, UM-HMC cell lines were sorted for cancer stem cells (ALDHhighCD44high) and non-cancer stem cells (ALDHlowCD44low) after being treated with MI-773 for 72 hours. Immediately after, (A) the collected cells were used to make whole-cell lysates for western blot analysis or (B) cultured in a 4-well chamber slide for two days prior to fixing and staining for pan-Cytokeratin and Dapi (scale bar=100μm). C, Graph depicting quantification of pan-Cytokeratin expression in (B). D-F, Cells were sorted for cancer stem cells and immediately plated in a 4-well chamber slide and cultured for 24 hours prior to treatment with 1 μM MI-773. D, Slides were fixed at 48- and 72-hours post-treatment and subsequently stained for pan-Cytokeratin and Bmi-1(scale bar=100μm). E, Graph depicting quantification of nuclear Bmi-1 expression in cancer stem cells or non-cancer stem cells. F, Graph depicting quantification of pan-Cytokeratin expression in cells treated with 1 μM MI-773 or vehicle. G, Representative micrographs of spheres formed from unsorted cells plated in sphere conditions and treated the following day with increasing doses of MI-773 for 7–9 days. H, Quantification of (G). I, Representative micrographs of spheres formed from unsorted UM-HMC cells plated in sphere conditions and treated 5 days after being plated. J, Quantification of (I). K, Representative micrograph of primary salispheres formed by UM-HMC cells transduced with shRNA-p53 or vector control cells. L, Quantification of (K). M, Microscopic view of single cell capture microfluidic device showing sphere growth over time (scale bar=100μm). N, Graph depicting sphere diameter from single cell salispheres generated by UM-HMC cells transduced with shRNA-p53 or vector control cells. Dotted lines depict cut-off for minimum sphere size (100μm). O, Graph depicting the number of secondary salispheres generated from UM-HMC-3B primary salispheres previously treated with MI-773 or vehicle for 7–9 days. P, Western blot of primary salispheres generated by UM-HMC cells transduced with shRNA-p53 or vector control cells. All results are representative of at least two independent experiments. Immunofluorescence was measured as the mean gray value normalized to DAPI. At least 5 arbitrary areas were selected for quantification. All sphere micrographs and quantification was done 7–9 days after being plated, unless noted otherwise. Two-tailed student’s t-test (α=0.05) was used for two group comparisons, two-way ANOVA with post-hoc Tukey (α=0.05) was used for pan-Cytokeratin time course, and one-way ANOVA with post-hoc Tukey (α=0.05) was used for all other comparisons. *P<0.05, ****P<0.0001. Means not sharing any lower-case letters are significantly different to each other.

