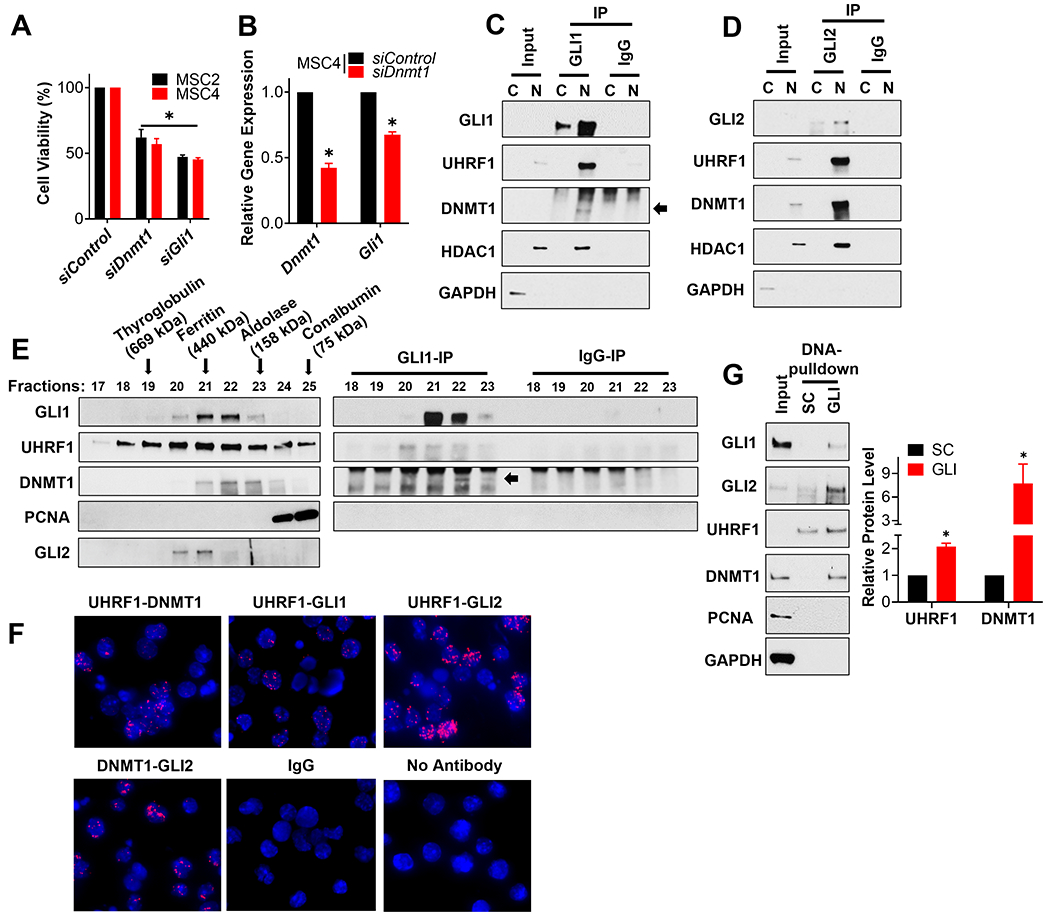
Figure 4. DNMT1 forms complexes with UHRF1 and GLI to regulate the viability of SHH-MB sphere cultures.

(A) The indicated SHH-MB sphere cultures were transfected with a scramble siRNA control (siControl) or pooled siRNA targeting Dnmt1 or Gli1. The number of viable cells was determined 5 days later using an MTT reduction assay and the data normalized to results from siControl transfected cells. (B) MSC4 cells were transfected with a scramble siRNA control (siControl) or pooled siRNA targeting Dnmt1 for 4 days. The expression of Dnmt1 and Gli1 was then determined by RT-qPCR, initially normalized to the expression of Gapdh and then to the results from siControl transfected cells. MSC4 cells were fractionated into nuclear (N) and cytoplasmic (C) enriched fractions, and GLI1 (C) or GLI2 (D) subsequently immunoprecipitated from such lysates. The immunoprecipitates were analyzed by immunoblotting for the indicated proteins. GAPDH is a cytoplasmic loading control and HDAC1, a known interactor of GLI1 and GLI2 [25], is a nuclear loading control. Representative blots are shown (n=3). (E) The nuclear enriched fraction of MB4 tumor cells was fractionated over a size-exclusion chromatography column. The various fractions were analyzed by immunoblotting for the indicated proteins (Left), or subjected to immunoprecipitation and immunoblotting for the indicated proteins (Right). The elution peaks of the indicated protein standards used to calibrate this gel filtration column are indicated with an arrow above the immunoblot. A representative blot is shown (n=3). (F) MSC4 cells were seeded on cover slips and subsequently subjected to a Proximity Ligation Assay (PLA) to detect potential direct interactions between the indicated proteins (red) with DAPI co-stained (blue). No antibody and IgG controls were included. Representative images are shown (n=3). (G) MSC4 cell lysates were used in a DNA pull-down assay with beads coupled to oligonucleotides containing either a GLI-binding site (GLI) or a scrambled control (SC) sequence. The bead-enriched proteins were then immunoblotted for the indicated proteins. A representative blot is shown (n=3) (Left). The level of UHRF1 or DNMT1 in the GLI-binding site pulldown was quantitated and normalized to that of the control lane (SC) to calculate relative UHRF1 or DNMT1 levels (n=3) (Right).
