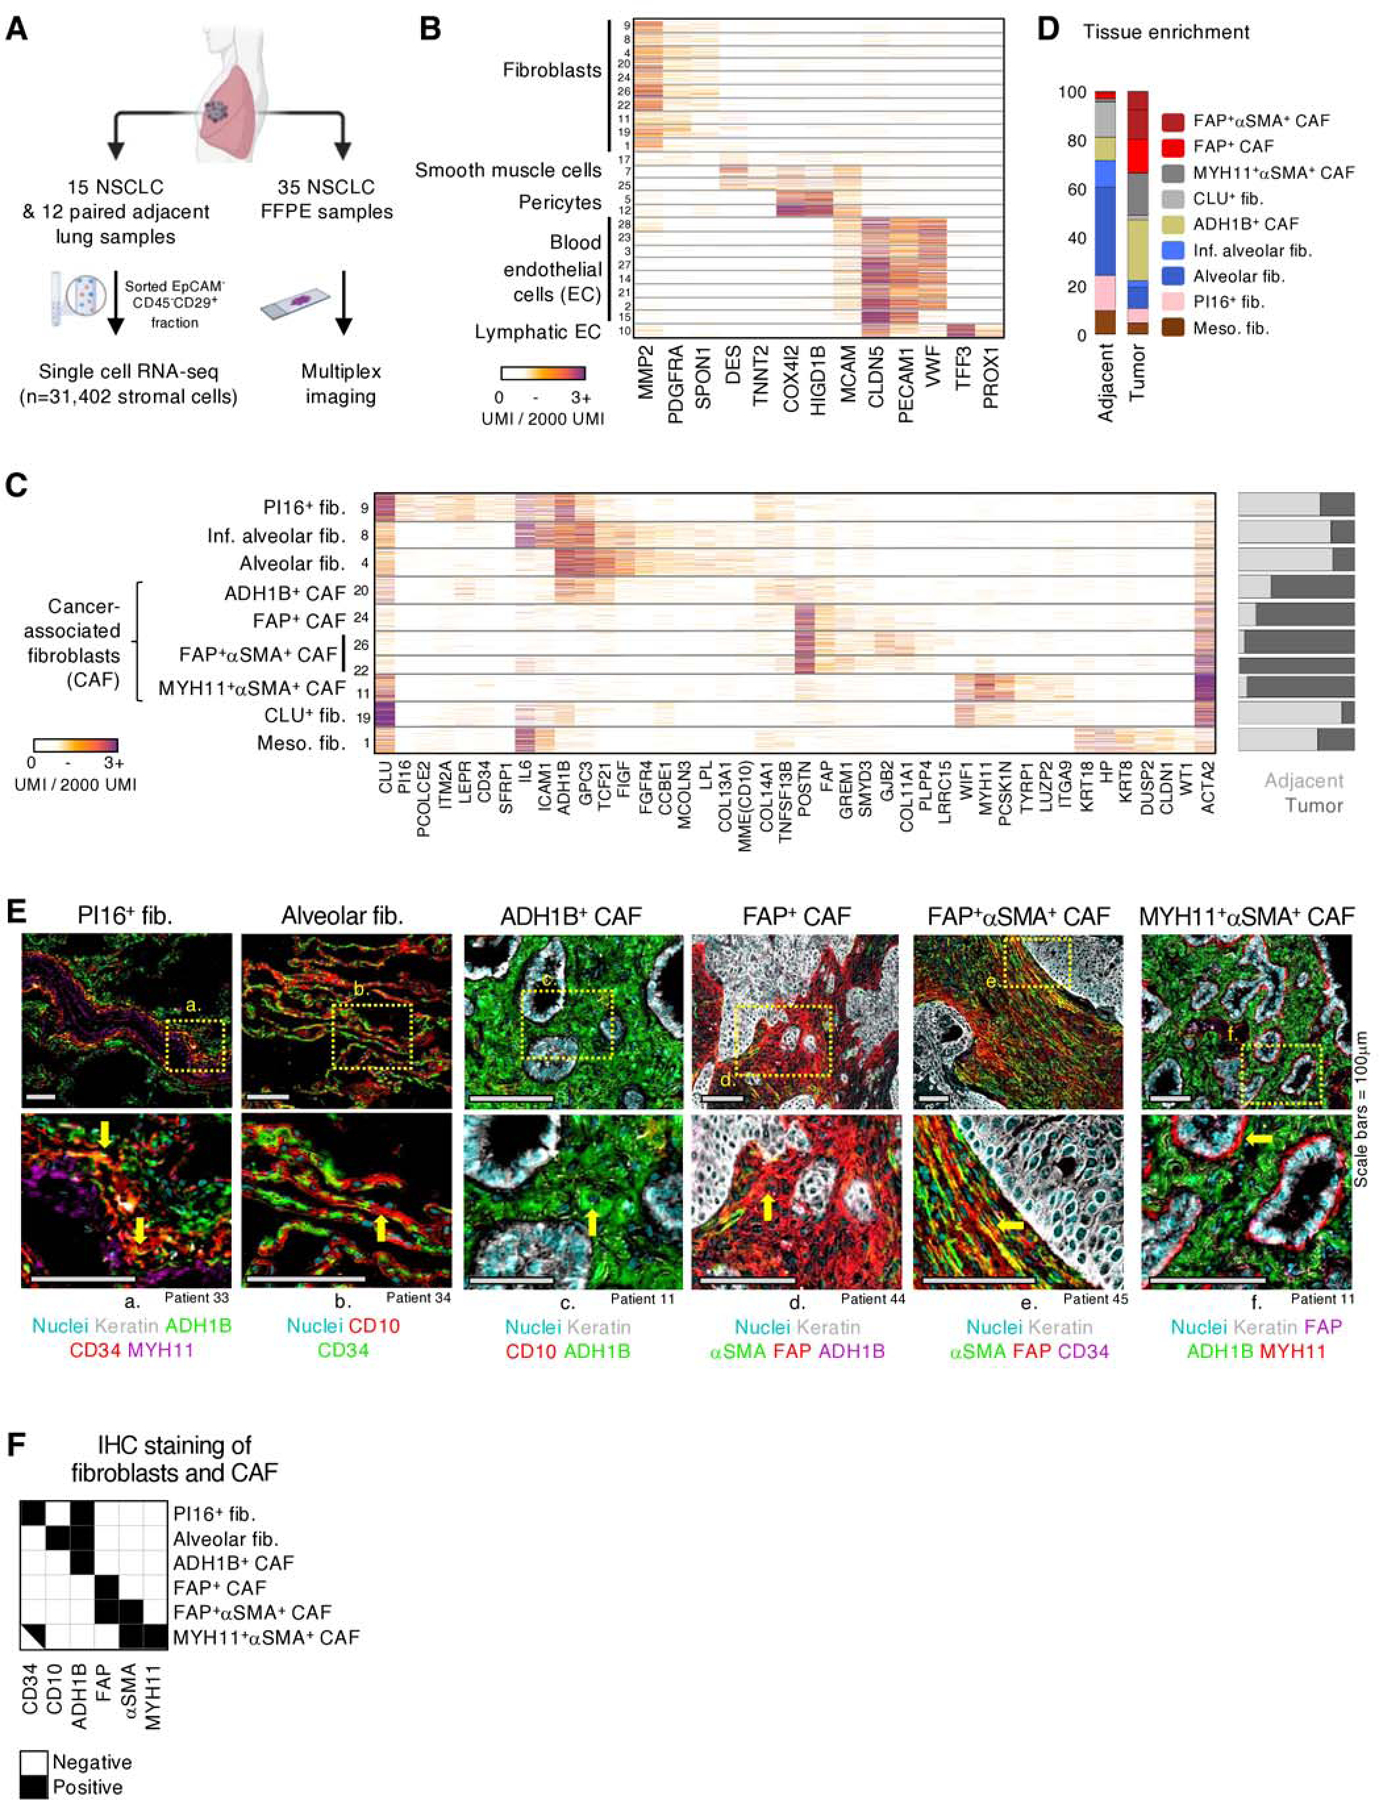
Fig. 1 |. Paired scRNAseq and IHC analysis identifies four CAF populations with distinct transcriptional profiles and structural organization in human NSCLC.

A, Tissue processing workflow for scRNAseq and IHC imaging of FFPE samples. B, scRNAseq mRNA counts (unique molecular identifiers, UMI) per cell (rows) of select stromal lineage marker genes (columns). Fibroblast, smooth muscle, pericyte, blood and lymphatic endothelial cell clusters are identified based on expression of marker genes such as, PDGFRA, DES, COX4I2, PECAM1, and TFF3, respectively. All cells displayed in this figure, and all subsequent similar scRNAseq figures, were downsampled to 2000 UMI. C, Extended gene lists highlighting gene expression profiles between the fibroblast subsets along with differing propensities for enrichment (right bar plot) in tumor (dark gray) or adjacent tissue (light gray). D, Averaged fibroblast composition in adjacent and tumor samples across all patients. The bar graph depicts the percentage of cells from each fibroblast subset among all fibroblasts. E, FFPE NSCLC sections were stained for fibroblast markers identified in scRNAseq results. All the scRNAseq-based fibroblast clusters (D) were detected utilizing IHC except meso. fib. and CLU+ fib., which were not in the scope of this study. Arrows highlight cells of interest (PI16+ fib.: CD34+ADH1B+MYH11neg, Alv. fib.: CD10+CD34neg, ADH1B+ CAF: ADH1B+CD10neg, FAP+ CAF: FAP+ADH1BnegαSMAneg; FAP+αSMA+ CAF: FAP+αSMA+CD34neg; MYH11+αSMA+ CAF: MYH11+FAPnegΑDH1Βneg). See Figure S3 for other stainings. All scale bars are 100μm. F, IHC staining presentation for the main identified fibroblast and CAF clusters.
