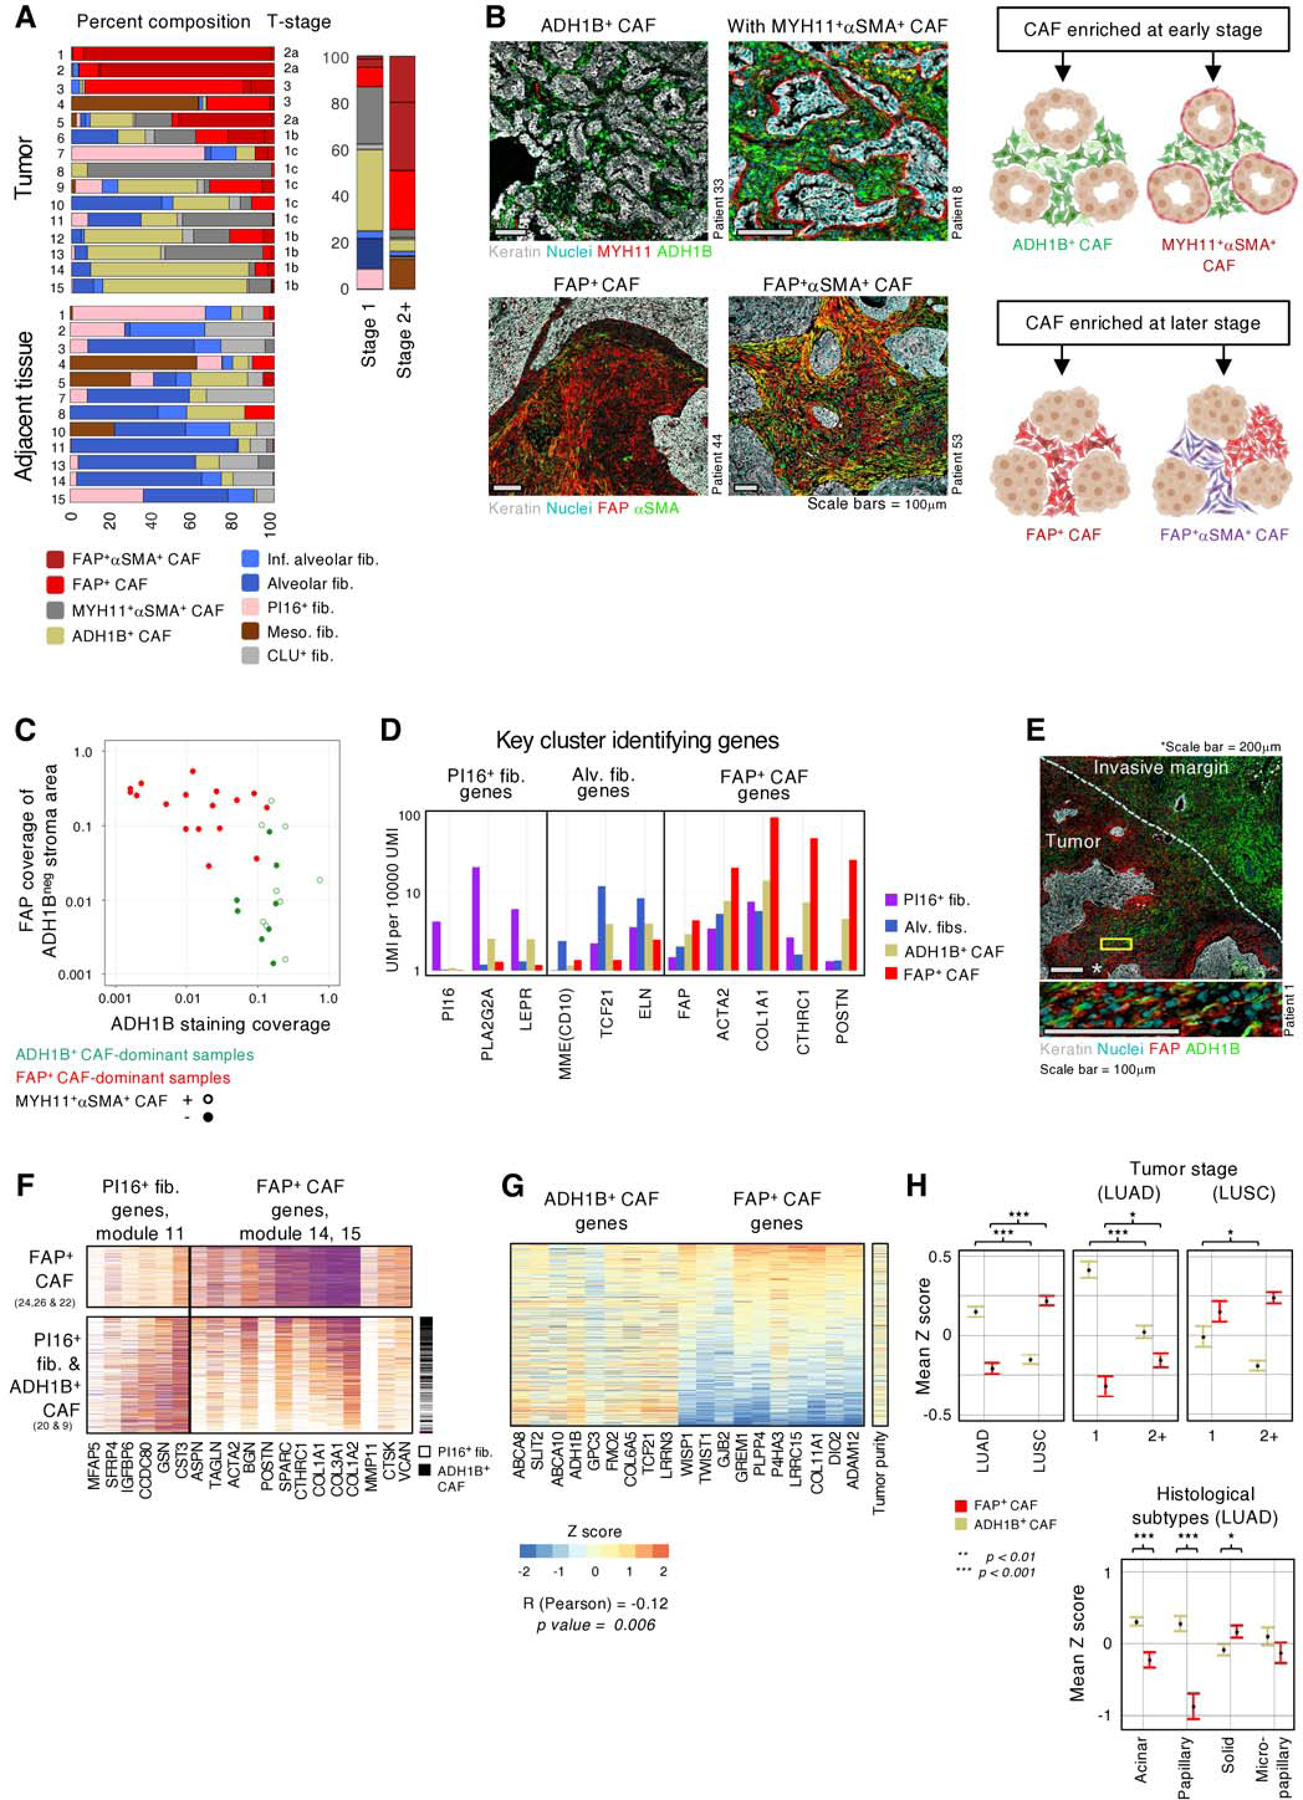
Fig. 3 |. ADH1B+ CAF and FAP+ CAF stratify NSCLC into two main stromal patterns associated with tumor stage and histology.

A, (left panel) Fibroblast subset composition, displayed by percentages, in individual tumor and adjacent tissue samples from the 15 scRNAseq patients. (right panel) Fibroblast distribution in stage 1 and stage 2+ tumors. The bar graph depicts the percentage of cells from each fibroblast subset among all fibroblasts. B, (Top left panels) ADH1B+ CAF rich patients showing ADH1B presence throughout the stroma. ADH1B+ CAF rich patients may present with (bottom left panel) or without (top left panel) a distinct single cell layer of MYH11+αSMA+ CAF at the tumor border. (Bottom left panels) FAP+ CAF rich patients with FAP staining throughout the stroma. The patients shown demonstrate the variable αSMA presentation in FAP+ cells. All scale bars are 100μm. (Right panels) Cartoon illustrating the observed presentation of multiple CAF subsets in NSCLC. C, ADH1B and FAP staining in the IHC cohort. ADH1B staining coverage in the stroma is shown on the X axis. FAP staining coverage in the stroma on regions that did not stain for ADH1B are shown on the Y axis. Tumors show significant preference for either ADH1B or FAP, with less than 5% coverage of the opposing stain. The 5% cutoff was selected after performing hypergeometric tests for 10 thresholds, at 5% increments, between 5% and 50%. The Bonferroni correction adjusted p value is 0.008. D, Mean expression of selected genes highlighting ADH1B+ CAF intermediate expression of PI16+ fib., alv. fib., and FAP+ CAF-associated genes. E, Tumor sample with an extensive invasive margin that displays a spectrum of ADH1B to FAP staining. (Zoom, bottom panel) Cells appearing to transition from ADH1B to FAP expression. Top panel scale bar is 200μm, bottom panel scale bar is 100μm. F, Expression of PI16+ fib. and FAP+ CAF module genes in PI16+ fib., ADH1B+ CAF, and FAP+ CAF. Based on gene expression patterns, ADH1B+ CAF appear to occupy an intermediate state of activation between PI16+ fib. and FAP+ CAF. G, Relative expression, displayed by Z score, of ADH1B+ CAF and FAP+ CAF-associated genes in TCGA LUAD bulk-RNAseq samples. ADH1B+ CAF and FAP+ CAF genes are significantly anticorrelated (Pearson) R = −0.12 and p = 0.006. The sample tumor nuclei count is used as a proxy of tumor purity and shows a relatively even distribution. H, TCGA LUAD mean Z score and standard error of mean (SEM) of ADH1B+ CAF and FAP+ CAF gene signatures stratified by tumor subtype (left and middle panels) or stage (right panel). Z score calculation is listed in methods and significance is calculated by independent t test (right panel).
