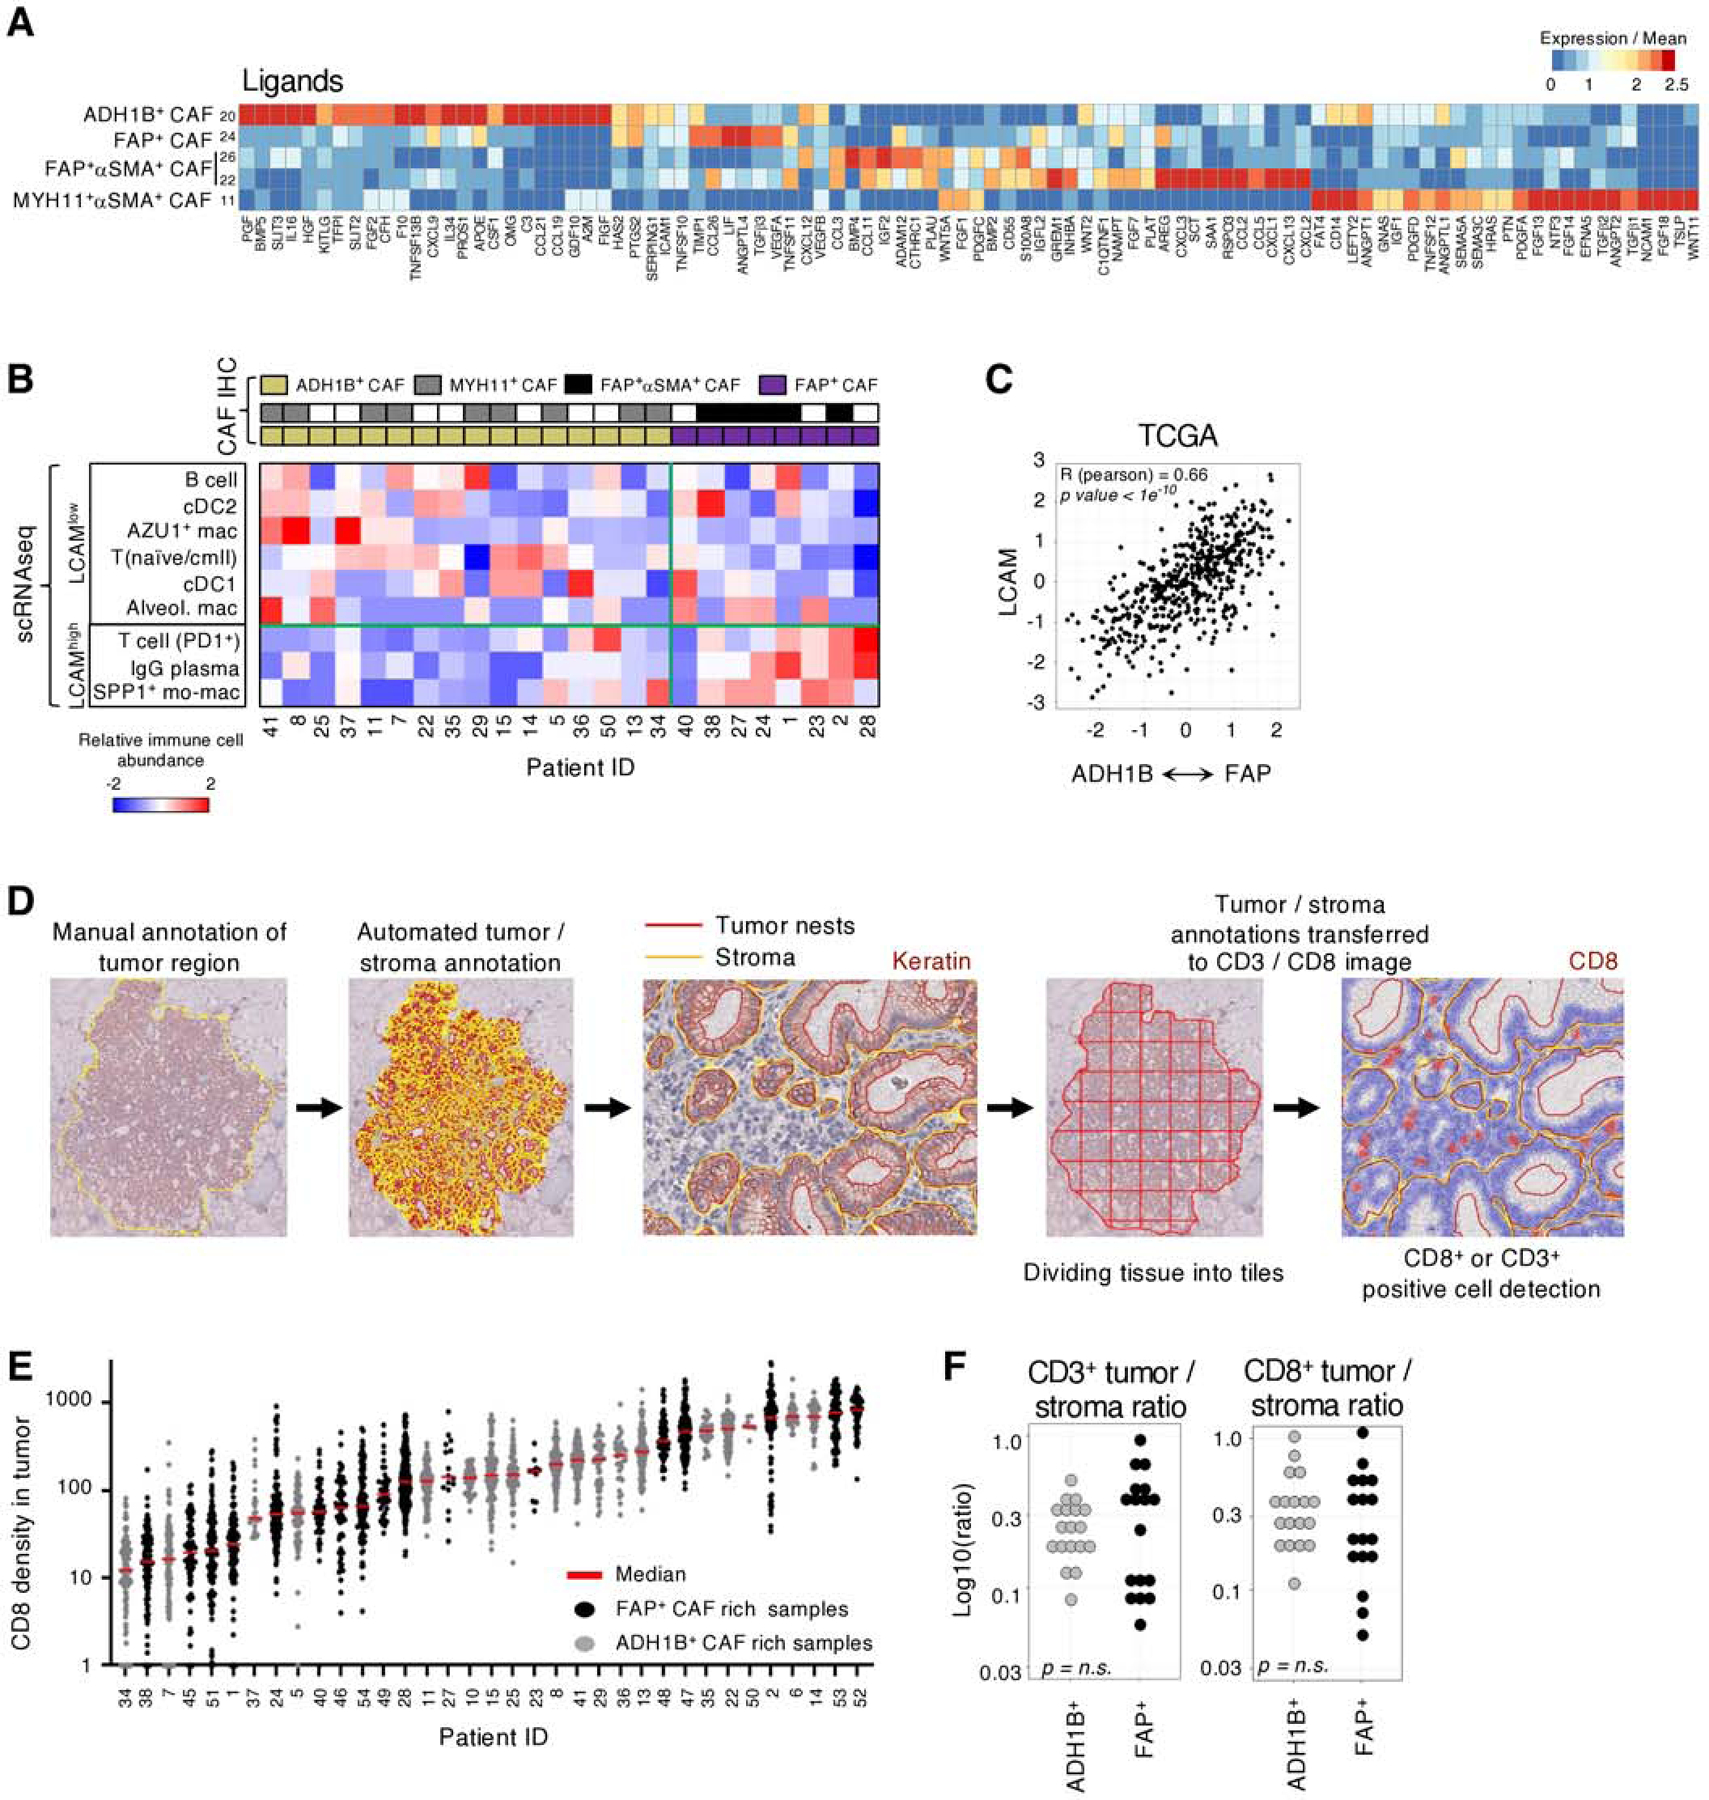
Fig. 4 |. ADH1B+ CAF and FAP+ CAF correlate with immune cell composition and not with T cell localization.

A, Gene expression over mean of highly variable immunomodulatory ligands in CAF clusters. B, Immune composition of scRNAseq tumor samples from (32). CAF phenotype is identified by IHC on the matched FFPE samples and then used to stratify samples. The relative abundance of each cell population within its respective compartment, i.e.; PD1+ T cells amongst all T cells, is calculated and then scaled across all tumors for the respective Z score value. LCAM score is significantly correlated with CAF phenotype (Pearson) R = 0.62, p = 0.01. C, Estimating the correlation between CAF phenotype and LCAM in TCGA LUAD samples. Each patients’ mean ADH1B+ CAF gene signature is subtracted from their mean FAP+ CAF gene signature and the resulting values are correlated with estimate LCAM score. The corresponding Pearson correlation values are shown. D, Schematic of QuPath methodology for tiling and T cell quantification. E, CD8+ cell infiltration into tumor nests in each patient (columns). Each point represents an individual 1000μm x 1000μm tile (all other tiling is 500μm x 500μm). F, IHC quantification of the tumor / stroma CD3+ or CD8+ cells per mm2 ratio. Tumor samples are stratified by their stroma profile (ADH1B+ CAF rich or FAP+ CAF rich) and no significant difference (t test) was observed.
