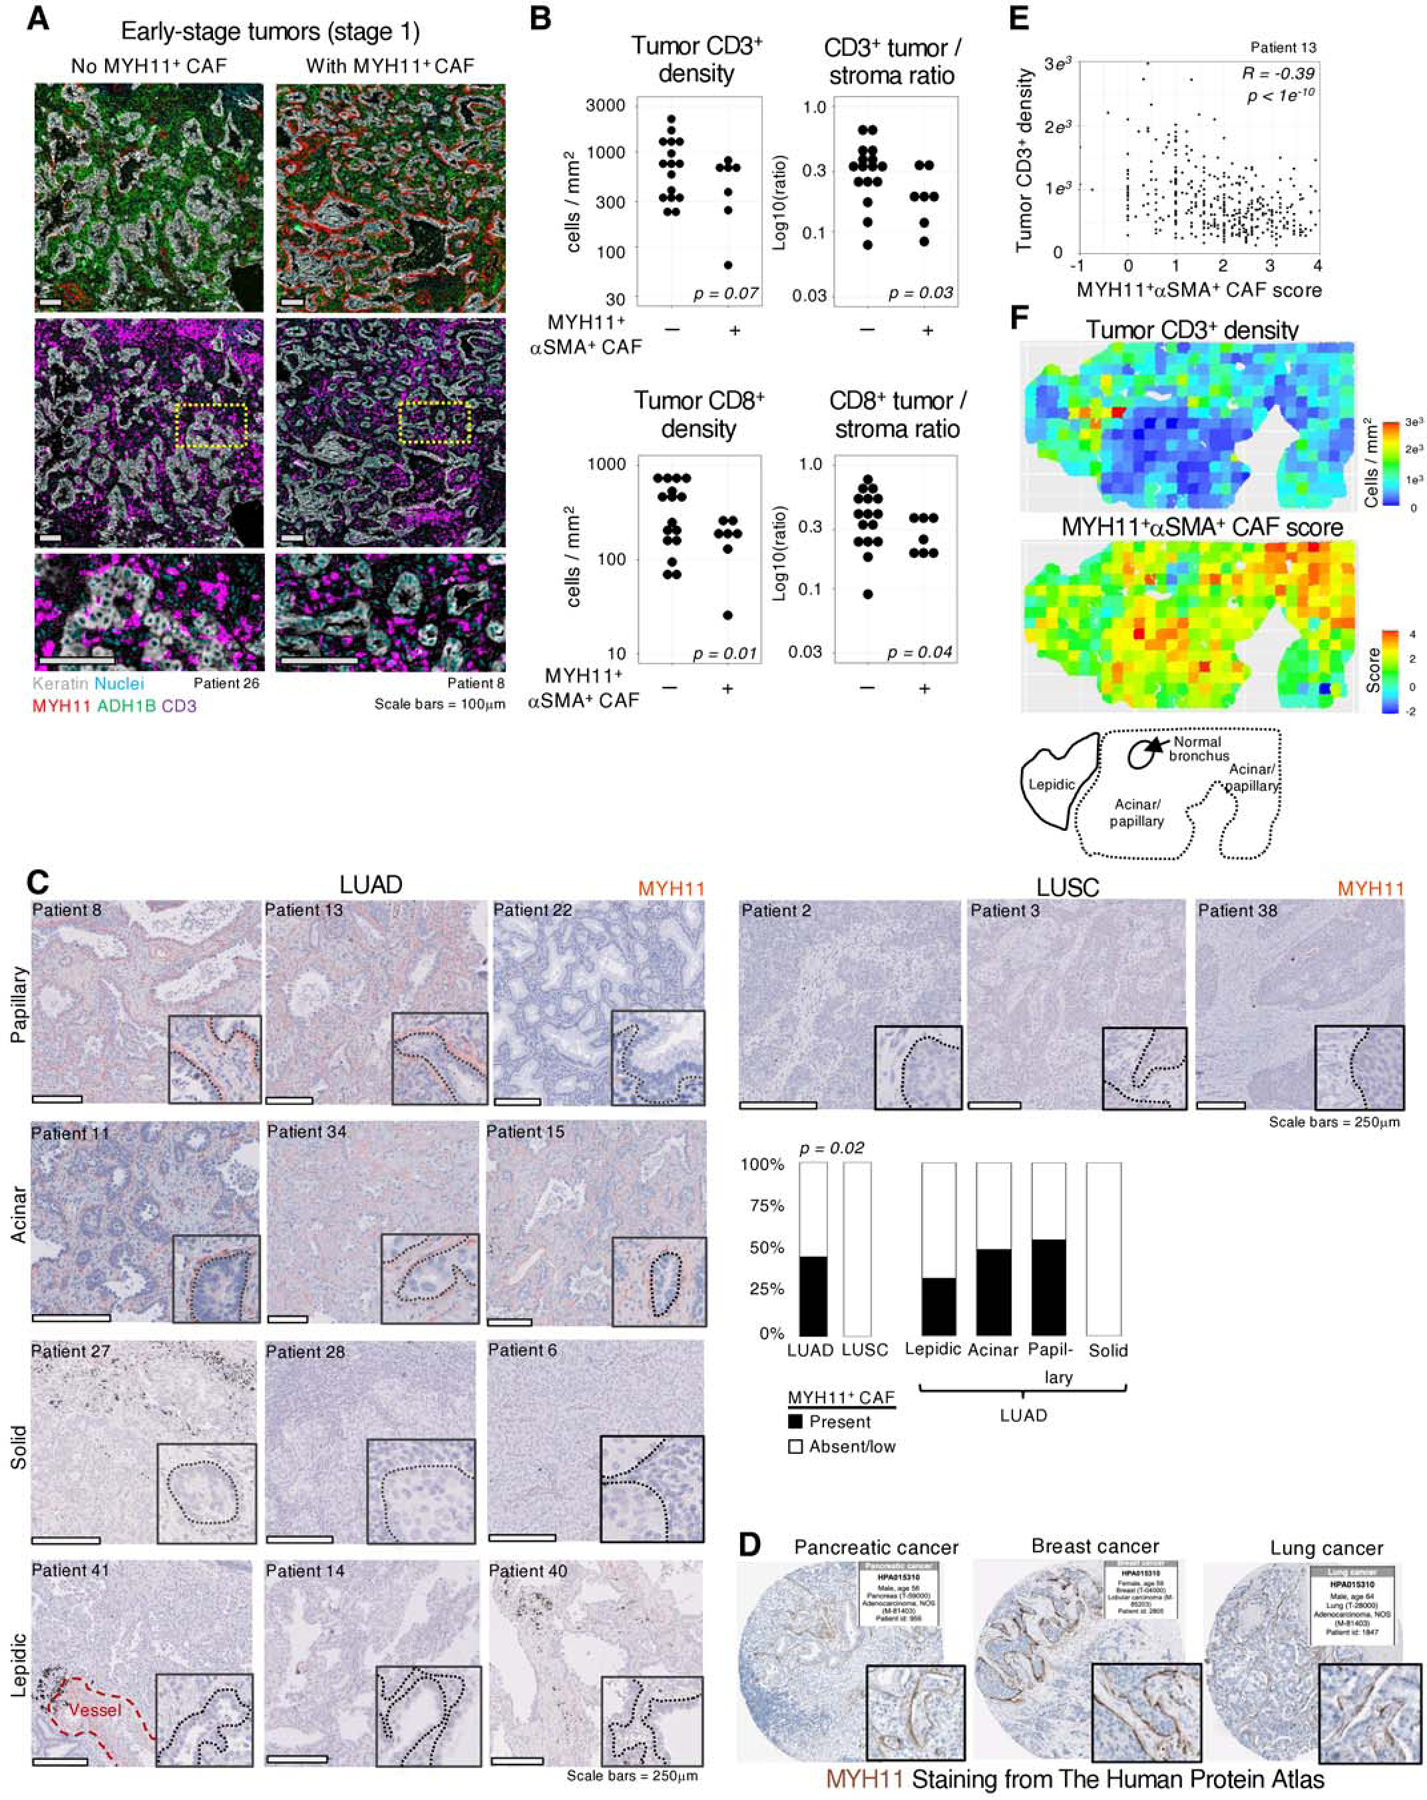
Fig. 5 |. MYH11+αSMA+ CAF are correlated with decreased T cell infiltration in tumor nests.

A, Representative examples of IHC stains from NSCLC tumors with and without MYH11+αSMA+ CAF present, showing CD3+ cell exclusion from tumor nests when MYH11+αSMA+ CAF are present. B, The presence or absence of MYH11+αSMA+ CAF demonstrates significant differences in tumor infiltrating CD3+ or CD8+ cells per mm2 (left) and the ratio of CD3+ or CD8+ cells per mm2 in the tumor versus stroma (right). Only early stage (tumor stage 1) patients were included to eliminate bias due to MYH11+αSMA+ CAF rarely being found at later stage. C, Representative images of MYH11 staining in multiple pathologies and histological subtypes. All scale bars are 250μm. (Barplot) MYH11+αSMA+ CAF distribution in different pathologies and histological subtypes in NSCLC. Significance determined by t test. D, MYH11 staining from The Human Protein Atlas. E, Quantification of 500×500μm tiles of both MYH11+αSMA+ CAF score, estimating tumor proximity of MYH11+αSMA+ cells by quantifying their enrichment within 10μm from tumor cells versus regions 20μm-30μm from tumor cells, and tumor infiltrating CD3+ cells per mm2. A high MYH11+αSMA+ CAF score is significantly anti-correlated (Pearson) with the number of tumor infiltrating CD3+ cells relative to the stroma. F, Visualization of the tiling described in E. (Bottom panel) Histological scoring of a tumor lesion highlighting that a high MYH11+αSMA+ CAF score is associated more with acinar/papillary phenotype, rather than lepidic.
