
Fig. 6 |. FAP+αSMA+ CAF define patterns of poor T cell infiltration within tumor lesions.
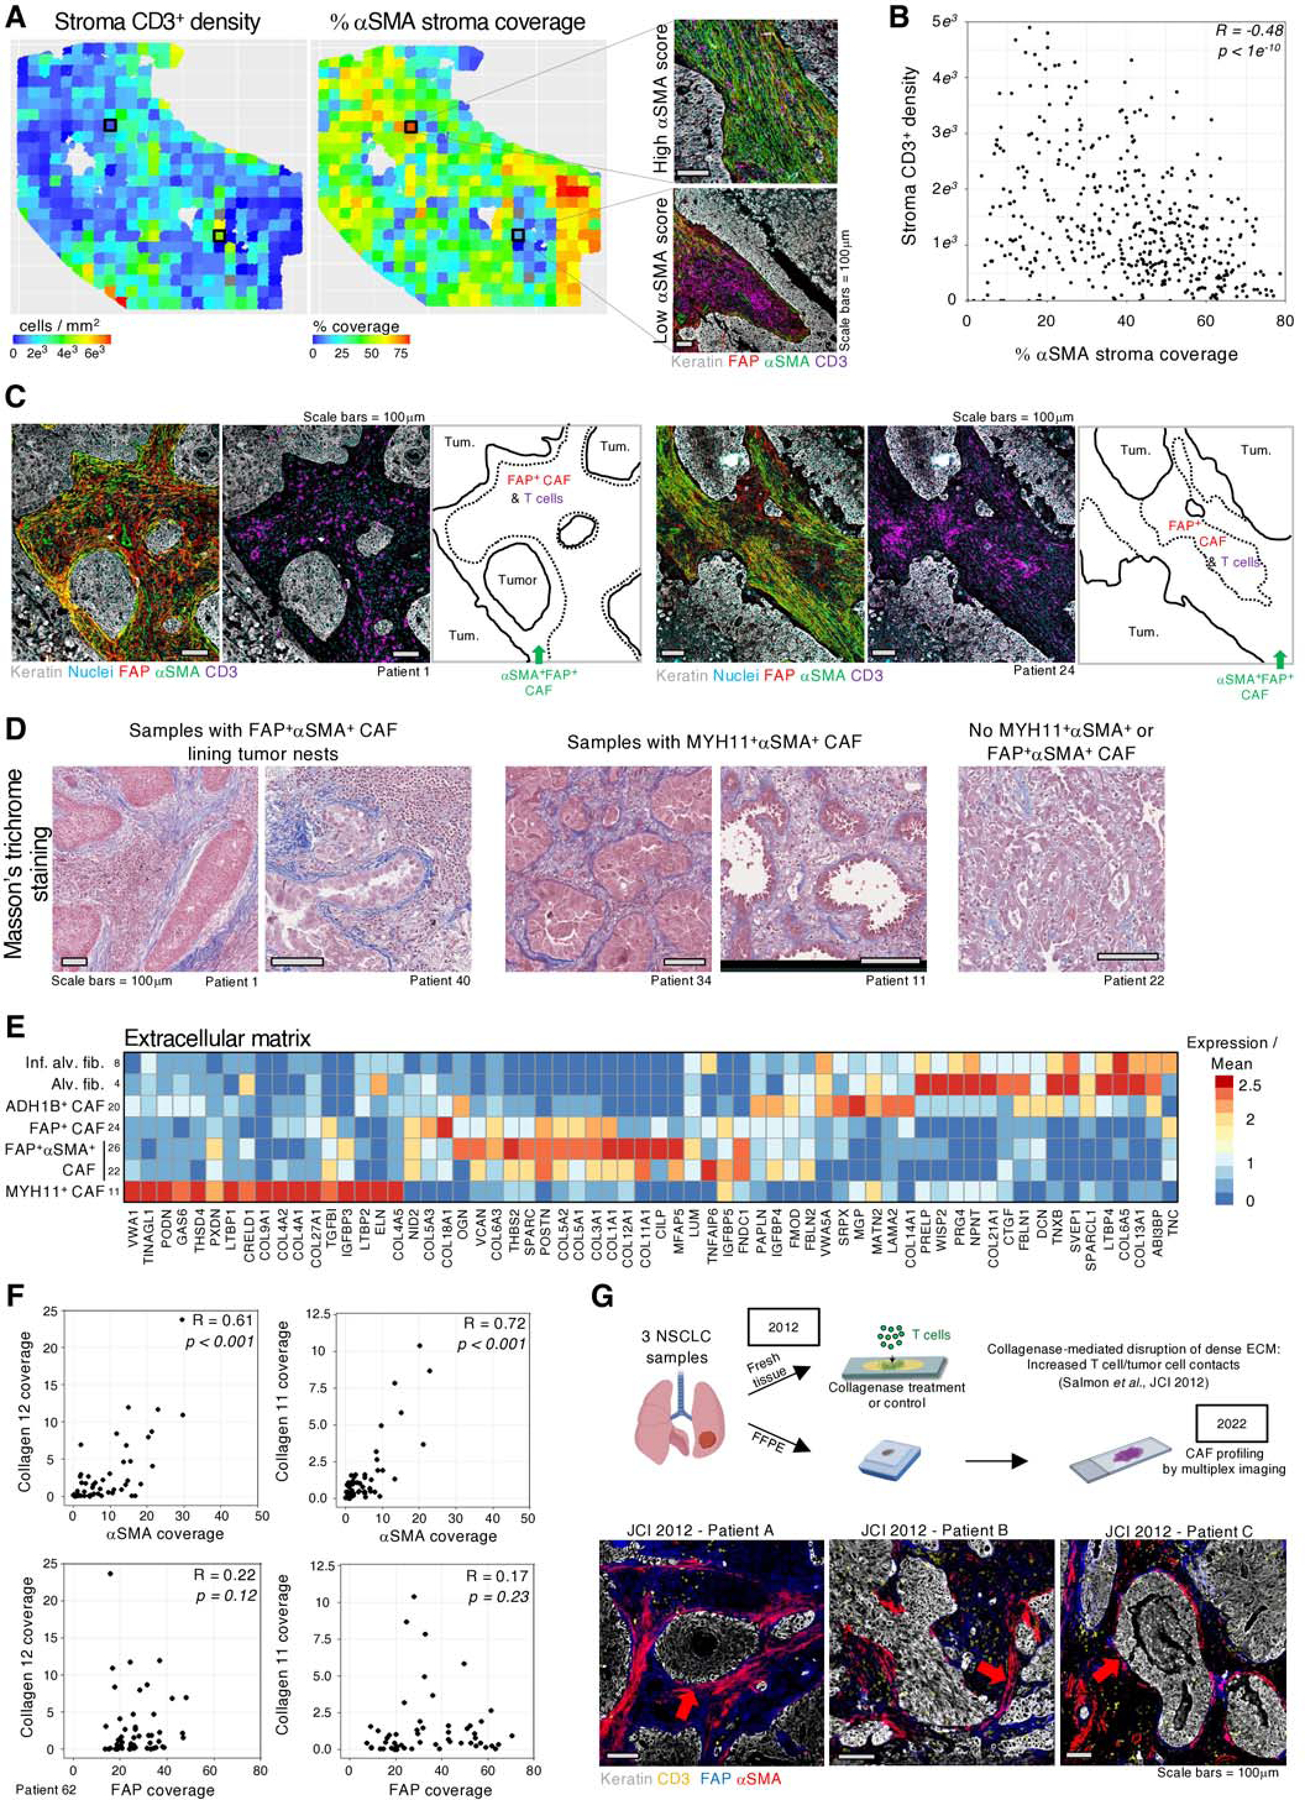
A, (Left panel) Intra-tumoral heterogeneity of αSMA coverage (middle panel) and CD3+ cell density in the stroma in 500×500μm tiles. (Right panel) Representative examples of tiles showing regions with high or low levels of αSMA. B, Quantification of αSMA coverage and CD3+ density in each tile (points) as defined in A, showing a significant anticorrelation (Pearson) of αSMA coverage and CD3+ cell density. C, Dense αSMA staining at tumor border associates with decreased CD3+ cell abundance. The green arrow highlights border regions with high αSMA and low CD3+ cells. D, Masson’s trichrome stains highlighting increased ECM at the tumor boundary in samples containing MYH11+αSMA+ or FAP+αSMA+ CAF. E, Averaged gene expression of highly variable ECM genes in CAF clusters. F, αSMA coverage of the stroma is significantly correlated (Spearman) with collagen XI and XII deposition, while FAP+ CAF show no correlation. G, (top panel) Our prior work in (7) showed that collagenase treatment of viable slices of NSCLC tumor tissue increased T cell access to tumor cells. FFPE sections from tumor samples of the same three patients were stained by multiplex IHC for markers of CAF identified in the present study. (bottom panel) FAP is found throughout the stroma and αSMA shows increased expression at the tumor border.