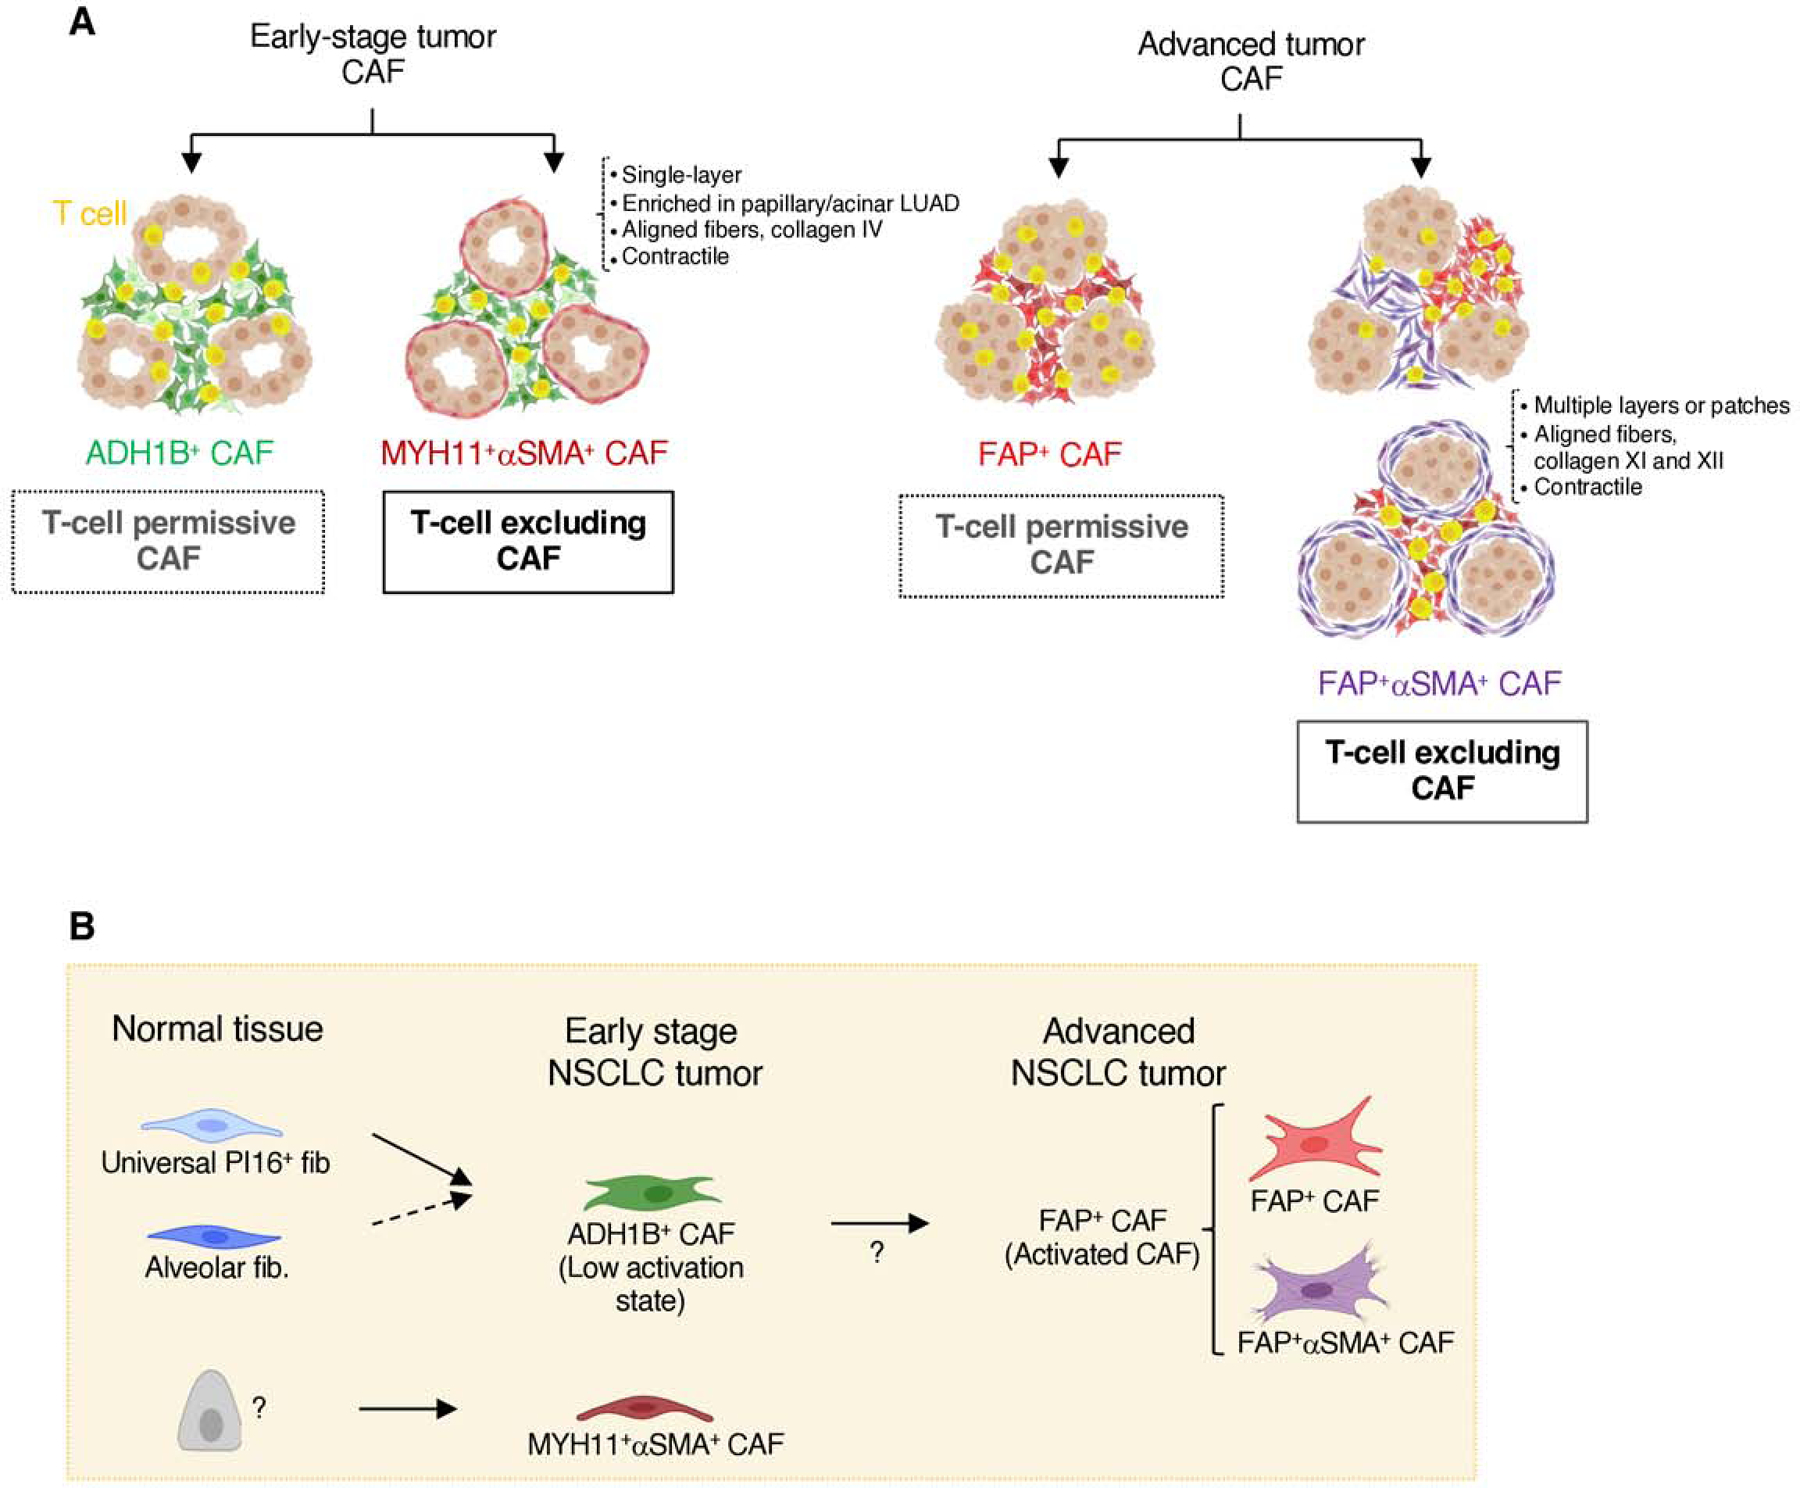
Fig. 7 |. Working model.

A, Graphical illustration of all stroma presentations found in this study. NSCLC samples enriched in ADH1B+ CAF throughout the stroma can be found with or without a single-cell layer of MYH11+αSMA+ CAF lining tumor cell aggregates. Those with MYH11+αSMA+ CAF show increased T cell exclusion from the tumor nests. NSCLC samples enriched in FAP+ CAF are found with variable abundance of FAP+αSMA+ CAF. Stromal regions with high αSMA have reduced T cell accumulation, and tumor nests surrounded by several layers of FAP+αSMA+ CAF show a lower T cell infiltration. B, Cartoon depicting the general distribution of fibroblast and CAF populations in adjacent lung tissue, early-stage NSCLC and advanced NSCLC, as well as the potential differentiation trajectories.
