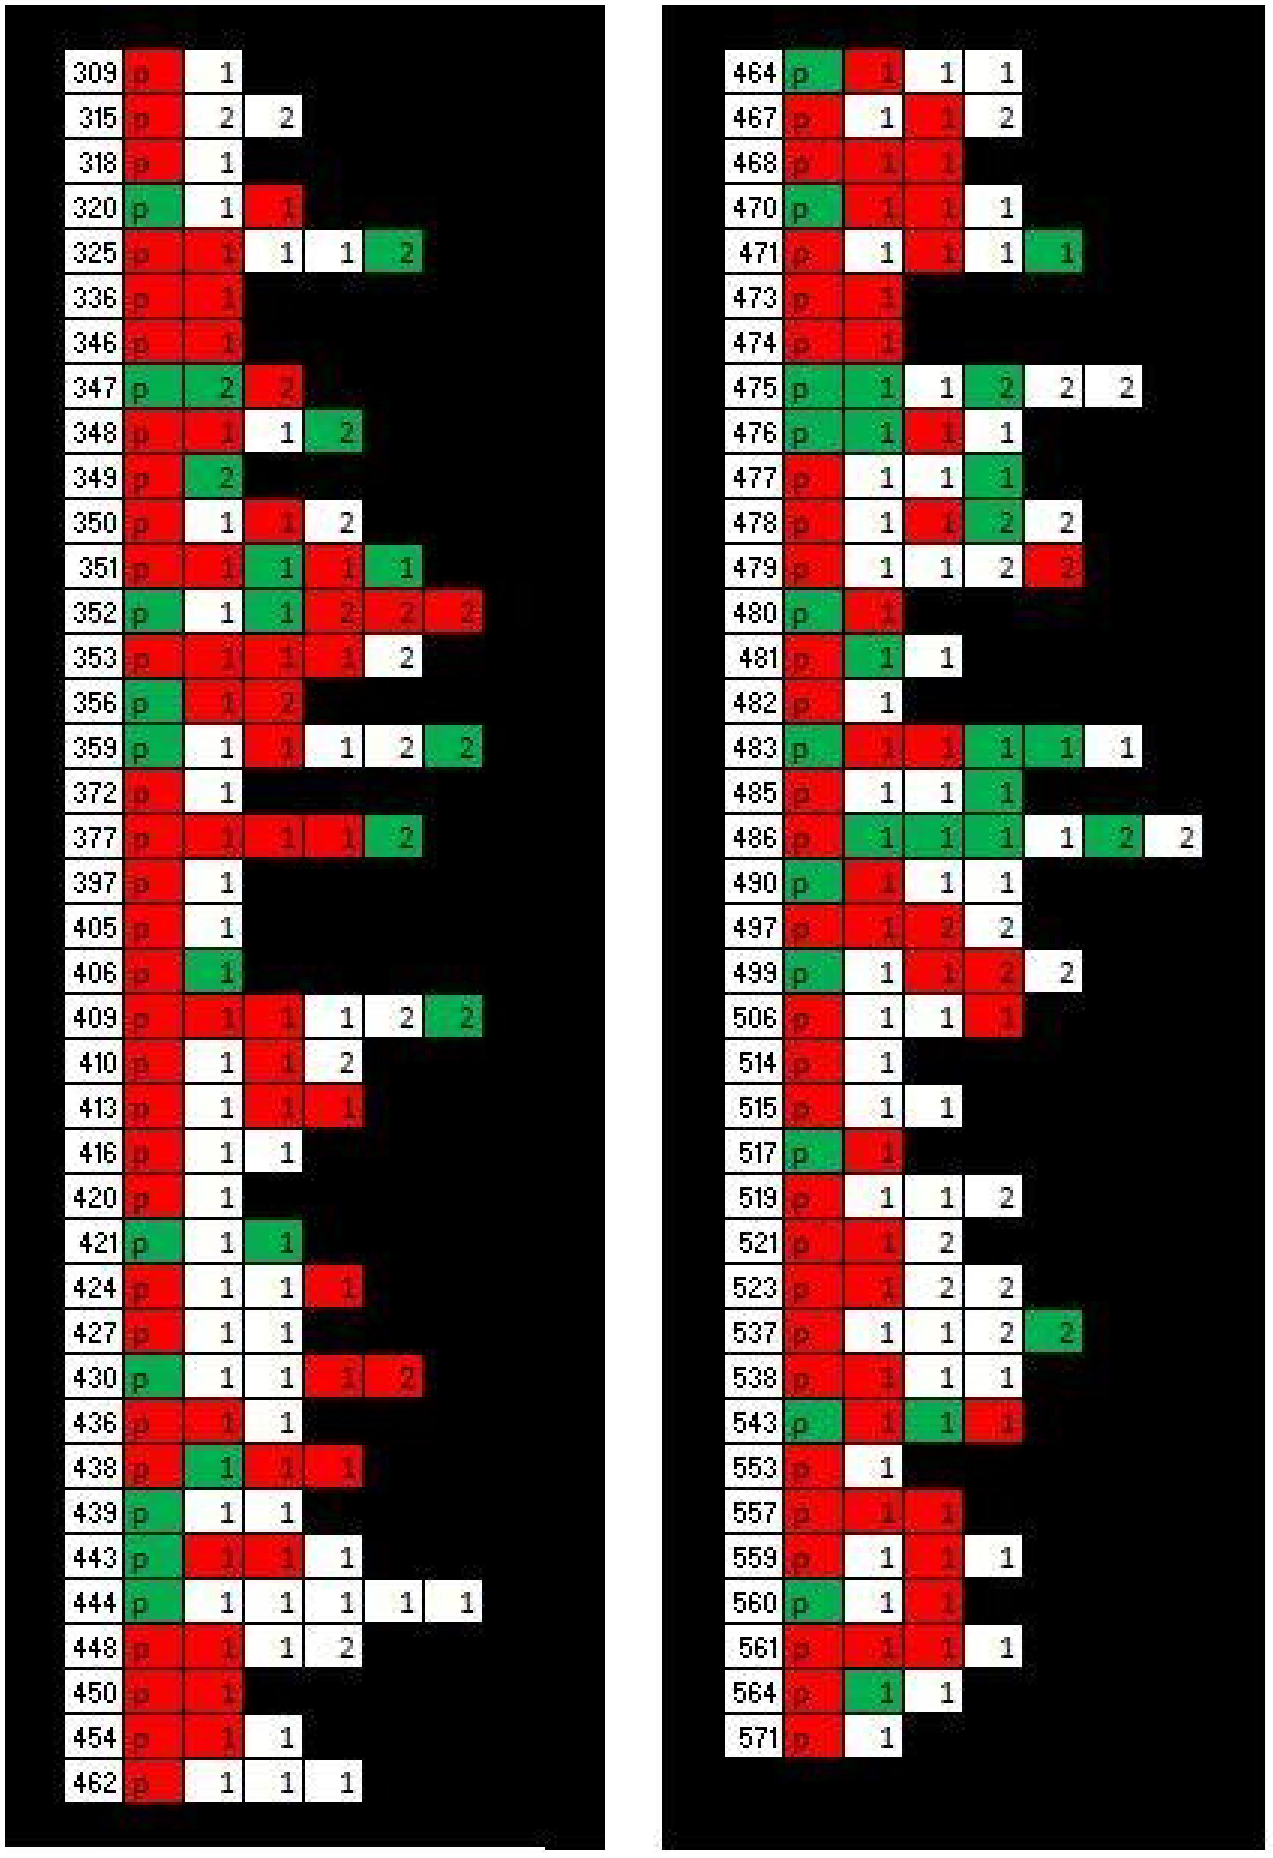
Figure 1: ET vs ET-plus status of enrollees in each family.

Figure depicts ET/ET-plus status of members of each family included in the final analyses. Left hand column lists family identification code; cells to the right of each code represent members of that family. Status indicated by cell color; red=ET-plus, green=ET, white=normal. P= proband, 1= first-degree relative, 2= second-degree relative. N families/probands = 77 (84 enrolled probands minus seven with unclassified ET/ET-plus status due to missing data), N relatives = 201 (230 enrolled relatives minus 6 with unclassified ET/ET plus status and minus 23 additional relatives of probands with unclassified status).
