Figure 1.

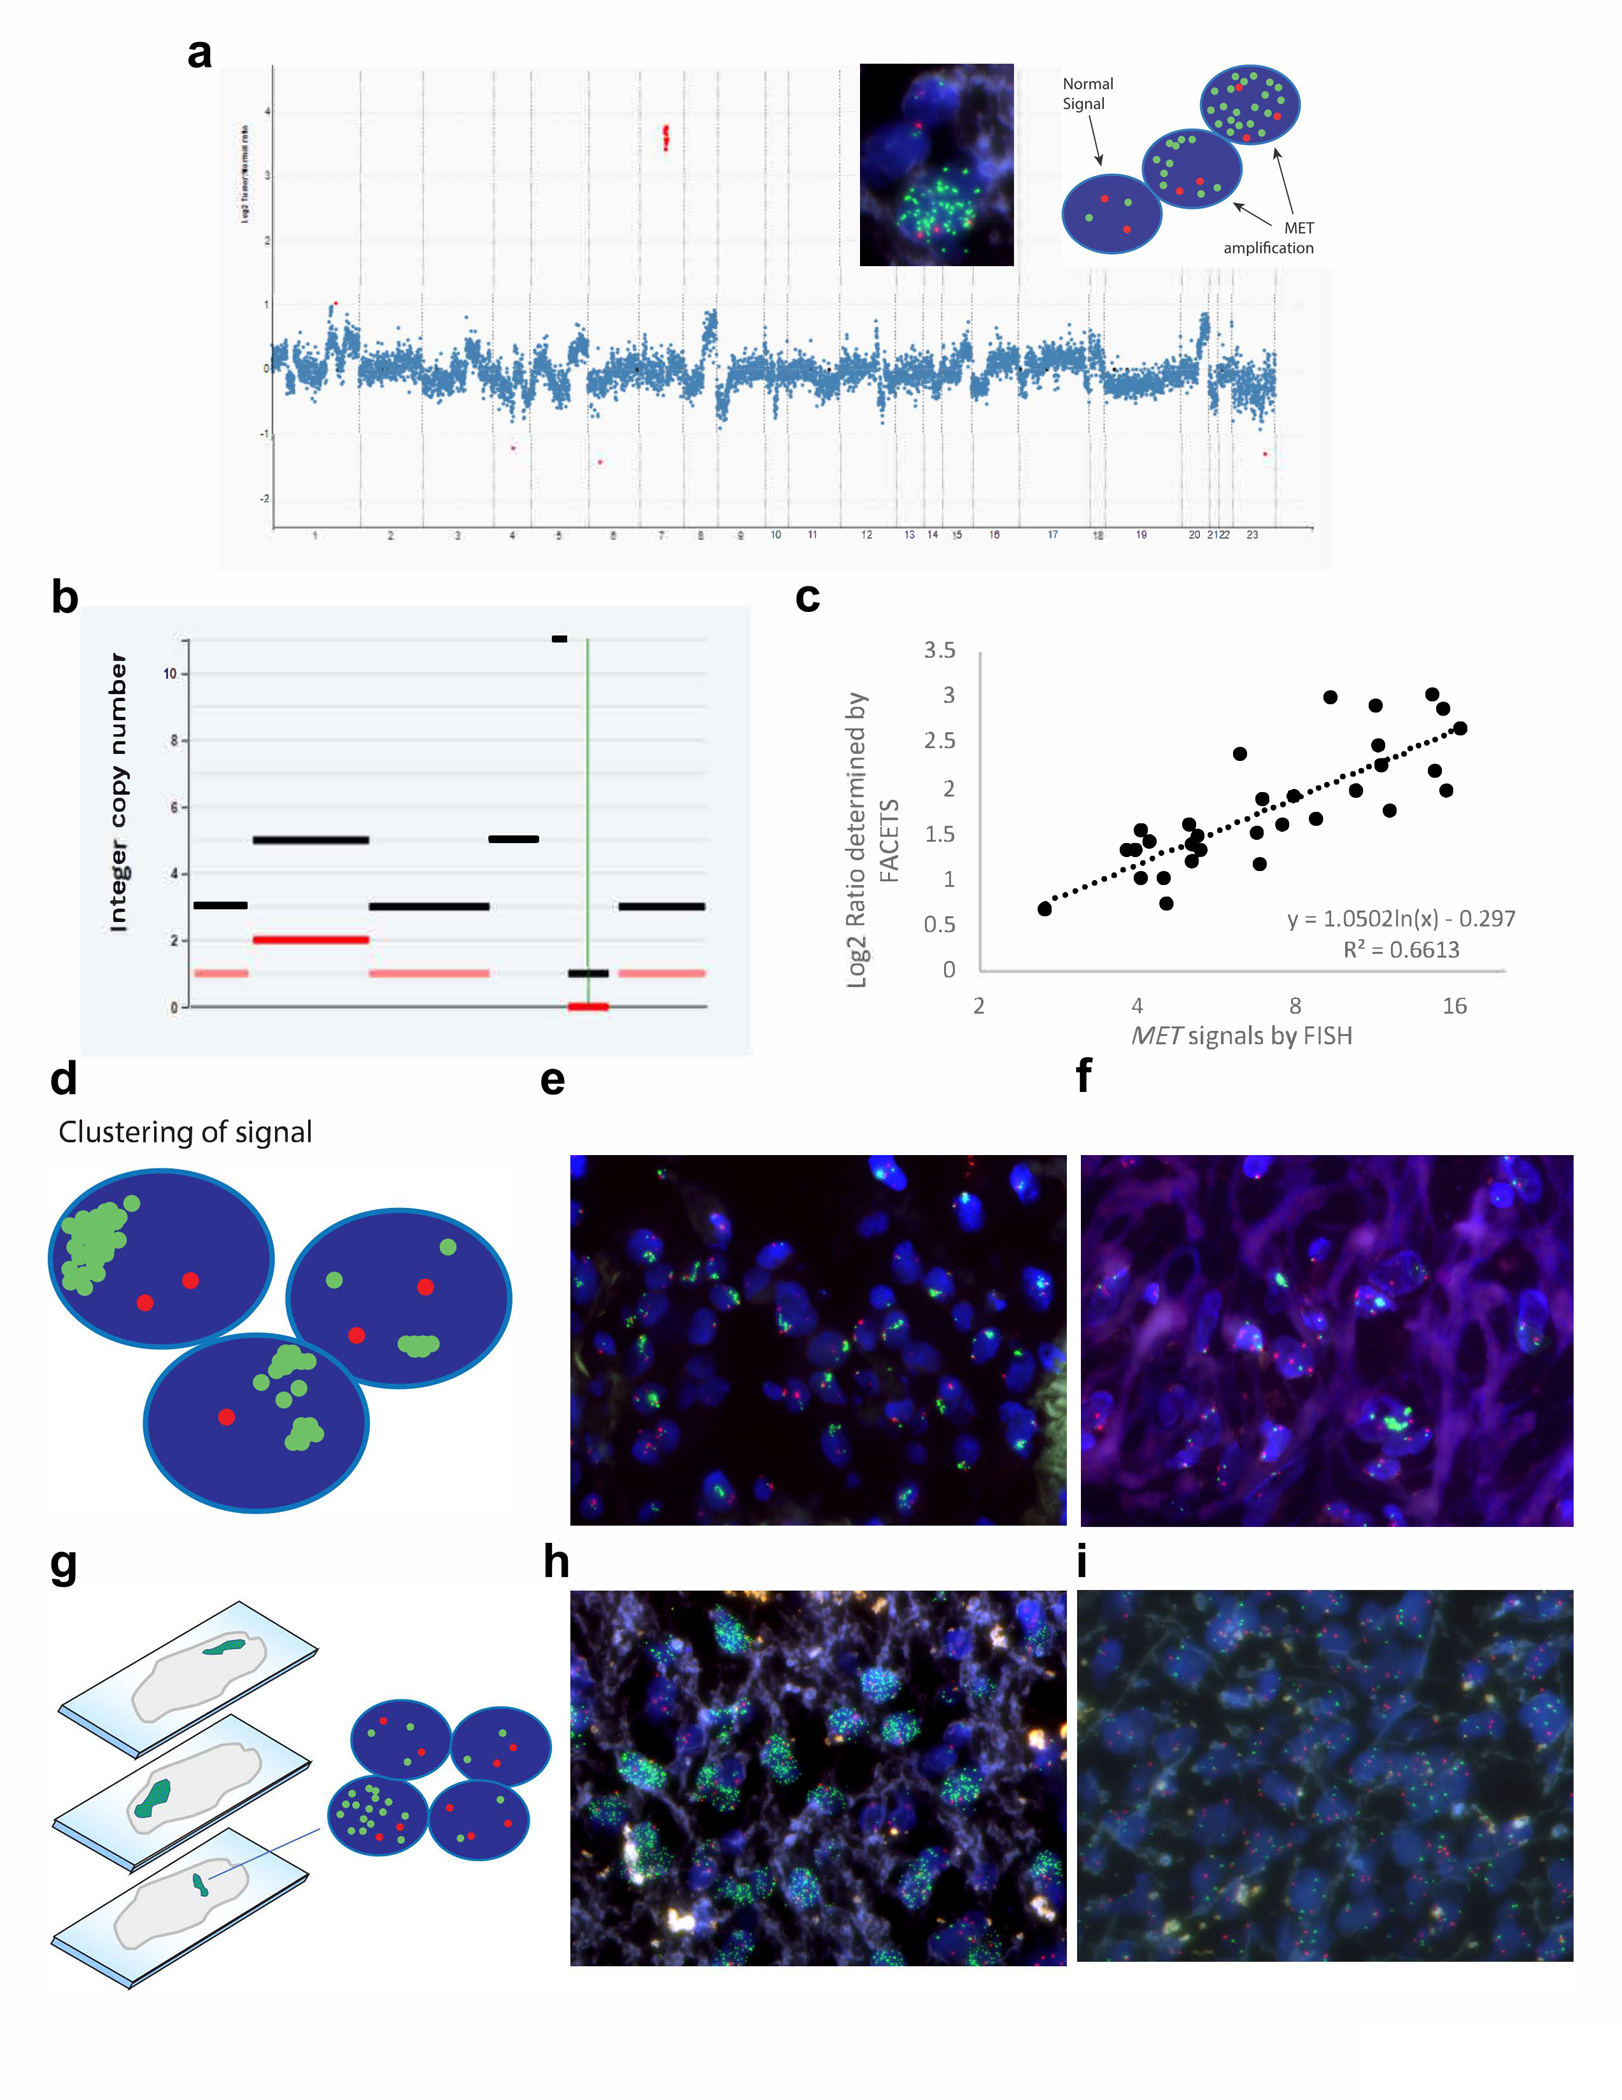
Comparison of MET amplification detection by fluorescence in situ hybridization (FISH) versus next generation sequencing. a Example copy number plot of a MET amplified case. The MET gene copy number, highlighted in red, is significantly higher than the rest of the copy number alterations, suggesting a biologically relevant focal amplification is driving oncogenesis. Insets show a representative FISH image and diagram demonstrating MET amplification. The normal FISH signal is two MET signals (green) and two CEP7 signals (red). When amplification of MET occurs, many green signals are observed, with an overall MET/CEP7 ratio ≥ 2, and some cells having more than 20 green signals. b Representative FACETS output demonstrating MET amplification at an integer copy number of eleven. c While there is good concordance when determining the binary call of whether MET is amplified, some discrepancy is observed with quantitative determination of MET copy number. When the signals are dispersed and evenly distributed, the signals can be accurately counted to give an assessment of MET copy number. Sometimes, however, difficulties arise. d-f MET signals can cluster, making it difficult to get an accurate count, especially when the number of signals per cell is greater than 20, and this can lead to an underestimation of the true MET copy number. g-i Other times, tumor heterogeneity can affect the count. While contiguous cells in a defined area are assessed, the areas selected for counting can be enriched for MET amplification, overestimating the true MET copy number. Both photographs are from the same tumor section,demonstrating one area with marked amplification (h), and another area without amplification (i).
