
Fig. 3 |. Skyline spectral library explorer view.
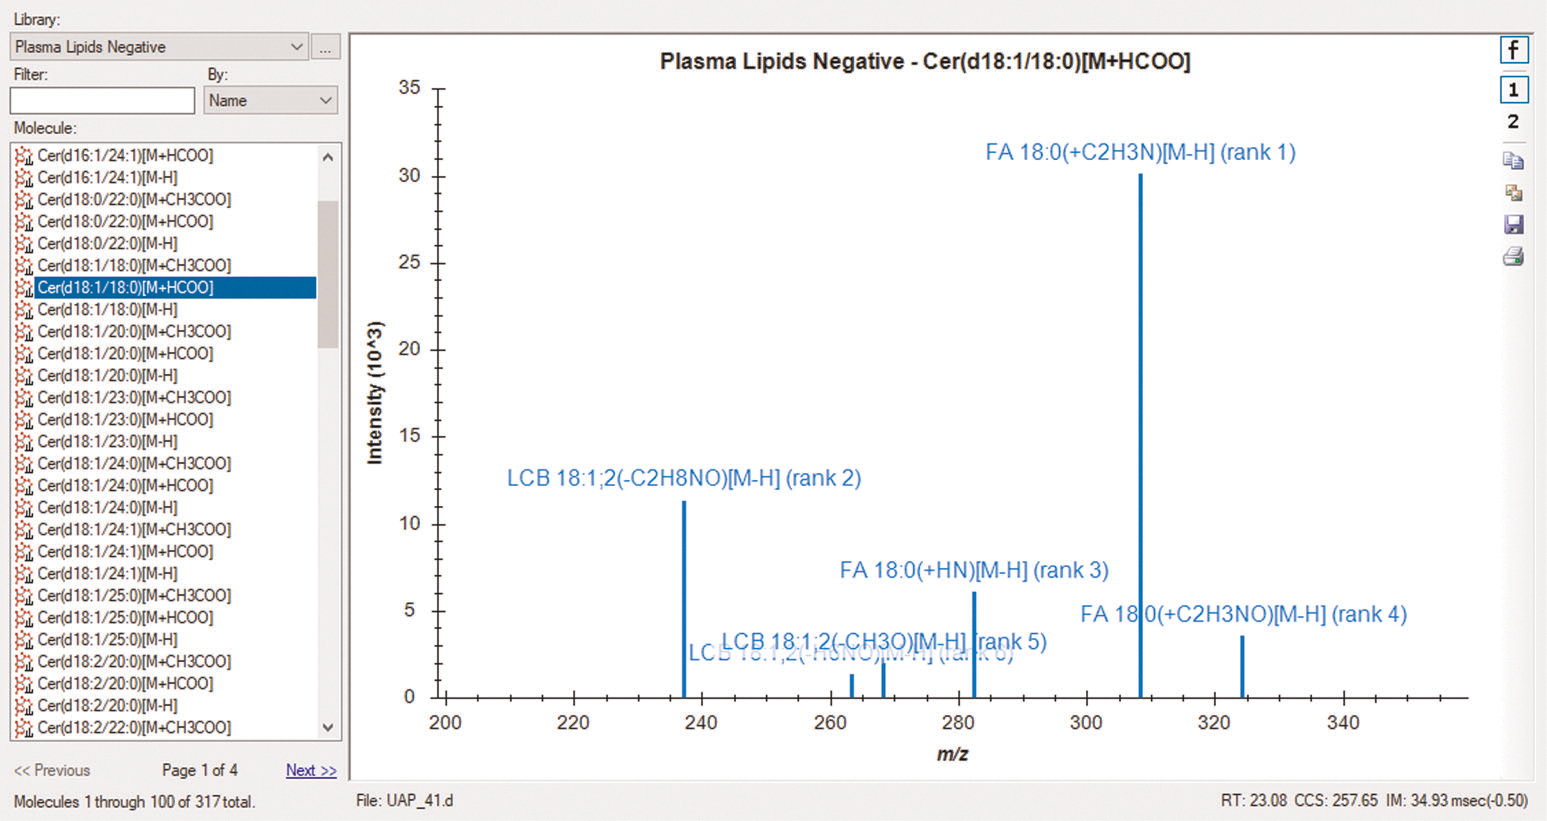
Skyline library MS/MS spectrum for Cer(d18:1/18:0) [M+HCOO]− from plasma lipid data collected in negative ionization mode. Fragment ions are labeled with names, adducts and intensity rankings. The precursor retention time (RT), CCS and drift time (IM) are also displayed in the bottom right corner. The spectral libraries can be viewed before and after importing data.