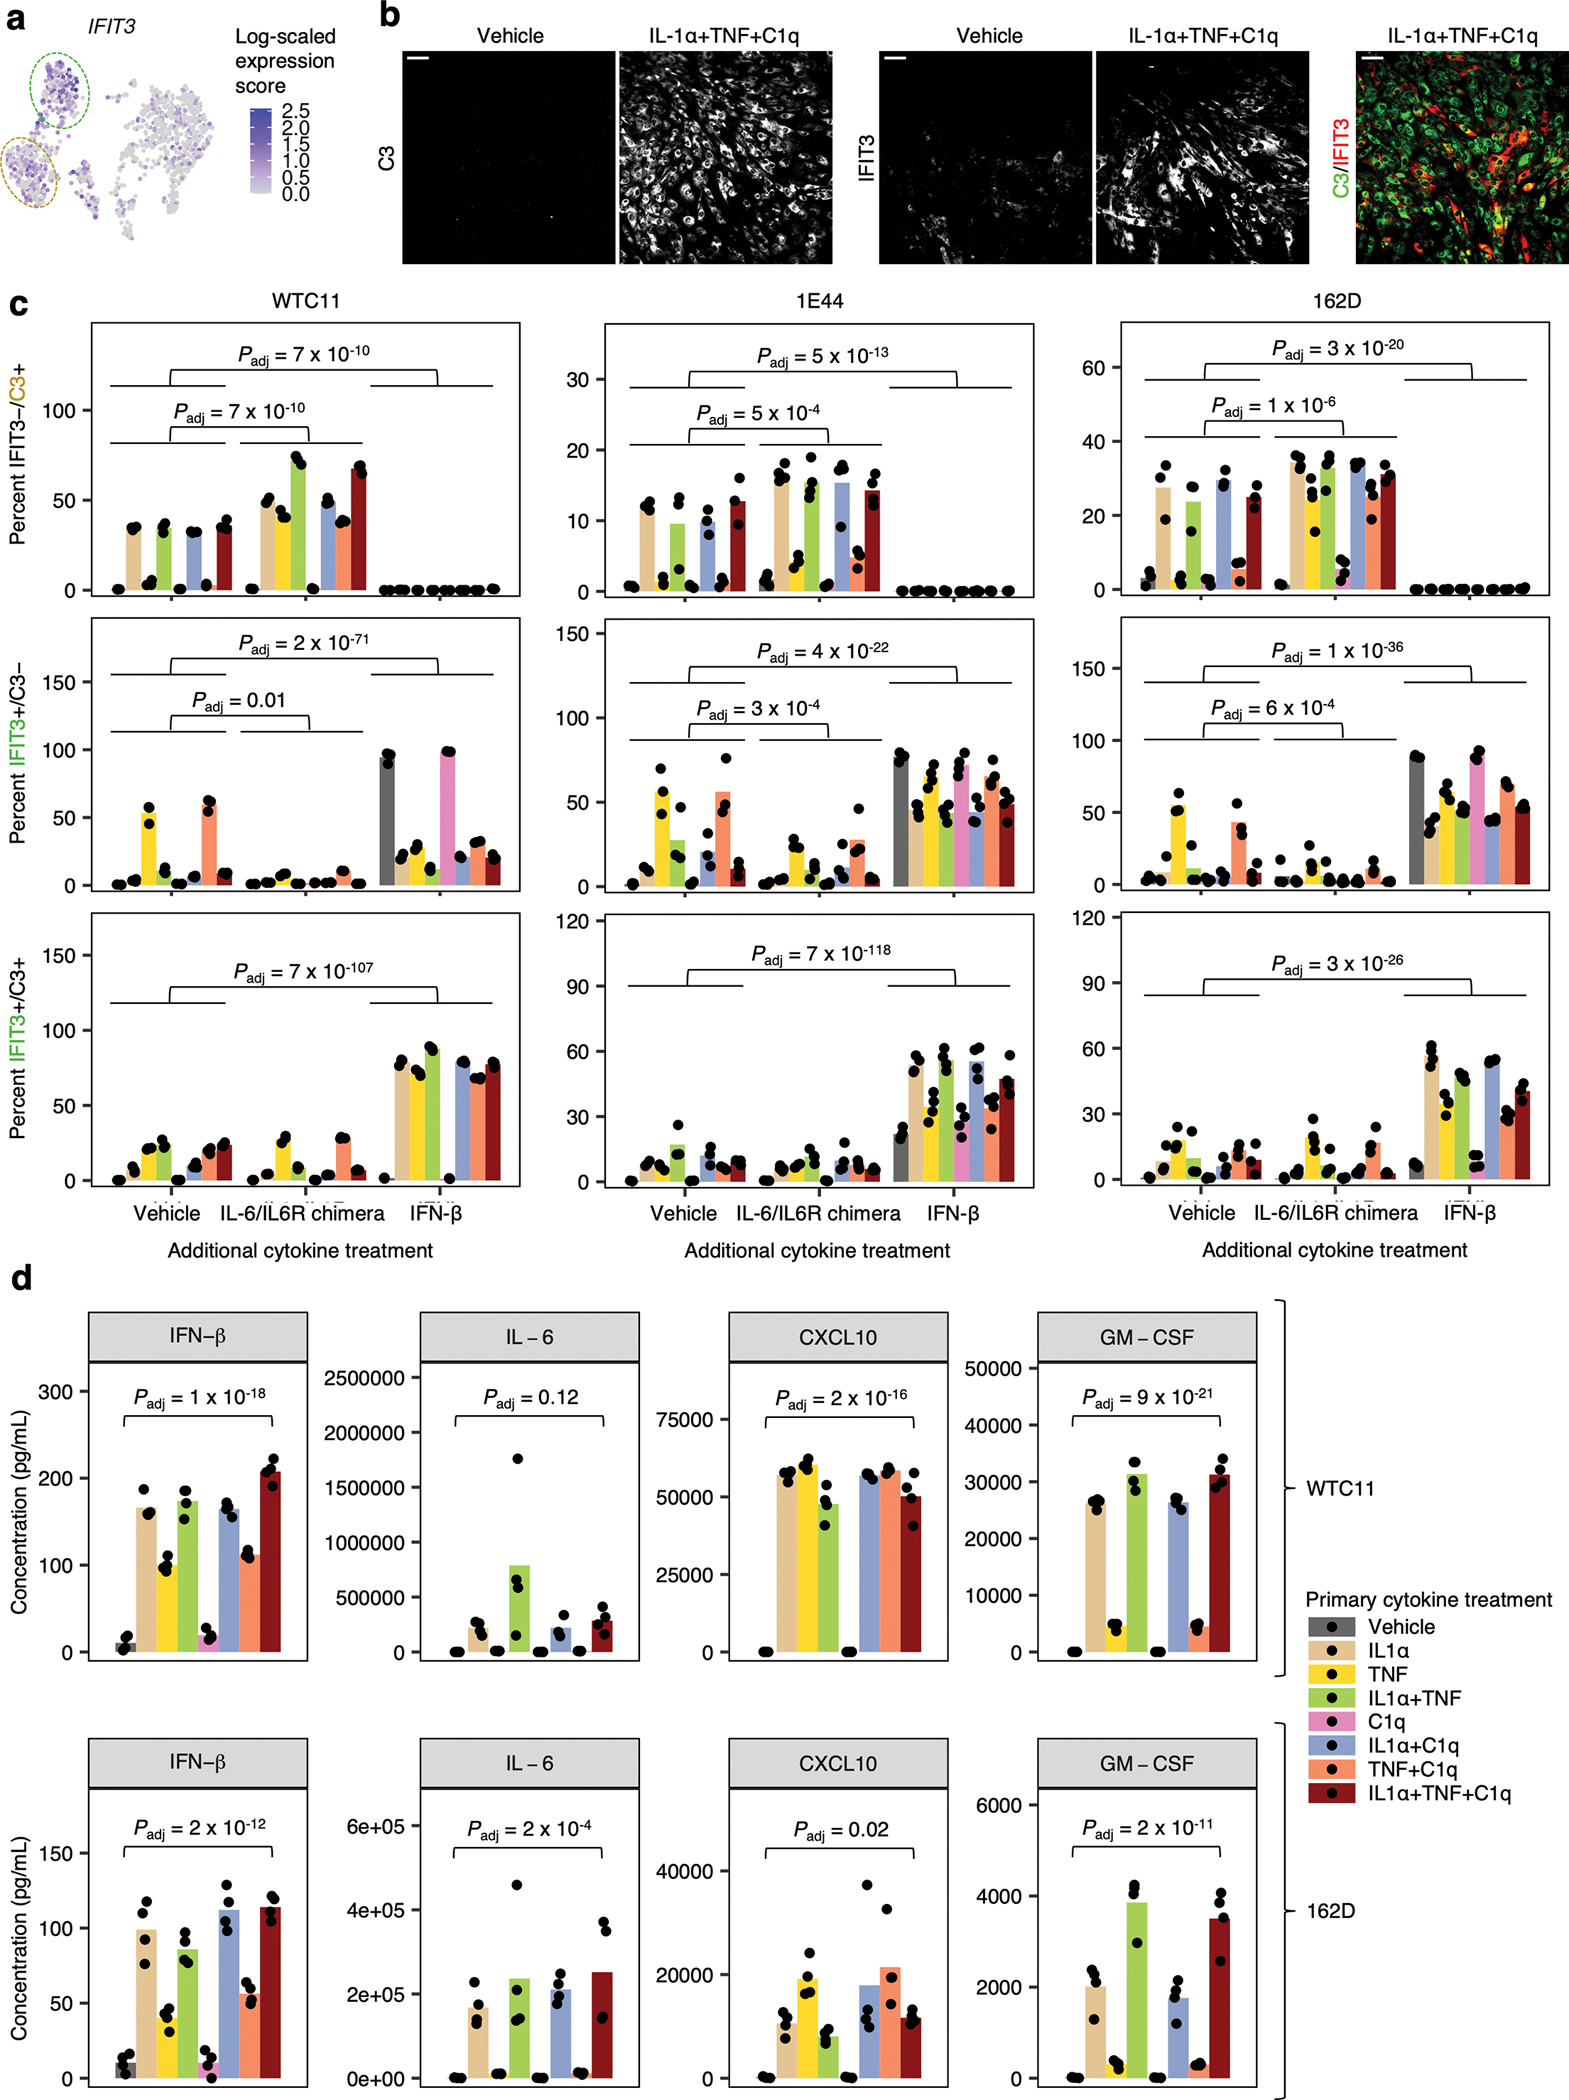
Extended Data Fig. 7 |. C3 and IFIT3 expression and cytokine production in iAstrocytes derived from multiple hiPSC lines.

a, Transcript levels of IFIT3 overlaid onto the UMAP embedding from Fig. 3a. b, Representative immunofluorescence images of C3 and IFIT3 staining (scale bar: 60 μm). c, Percent IFIT3−/C3+, IFIT3+/C3−, or IFIT3+/C3+ cells measured by immunofluorescence in iAstrocytes derived from multiple hiPSC lines (WTC11, TCW-1E44, 162D) treated with vehicle control vs. all possible combinations of IL-1α, TNF, and C1q, in the absence (n = 3 wells per condition) or presence of additional IL-6/IL6R chimera (25 ng/mL) or IFN-β (5 ng/mL) added concurrently (n = 4 wells per condition). D, Concentration of IFN-β, IL-6, CXCL10, or GM-CSF in conditioned media from iAstrocytes derived from multiple hiPSC lines (WTC11, 162D) treated with vehicle control vs. all possible combinations of IL-1α, TNF, and C1q (n = 4 wells). For panels c a, P values were calculated using beta regression (two-sided Wald test; see Methods). For panel d, P values were calculated using linear regression (two-sided Wald test; see Methods). P values were adjusted for multiple testing (Padj; Holm’s method) per family of tests (all comparisons within a plot).
