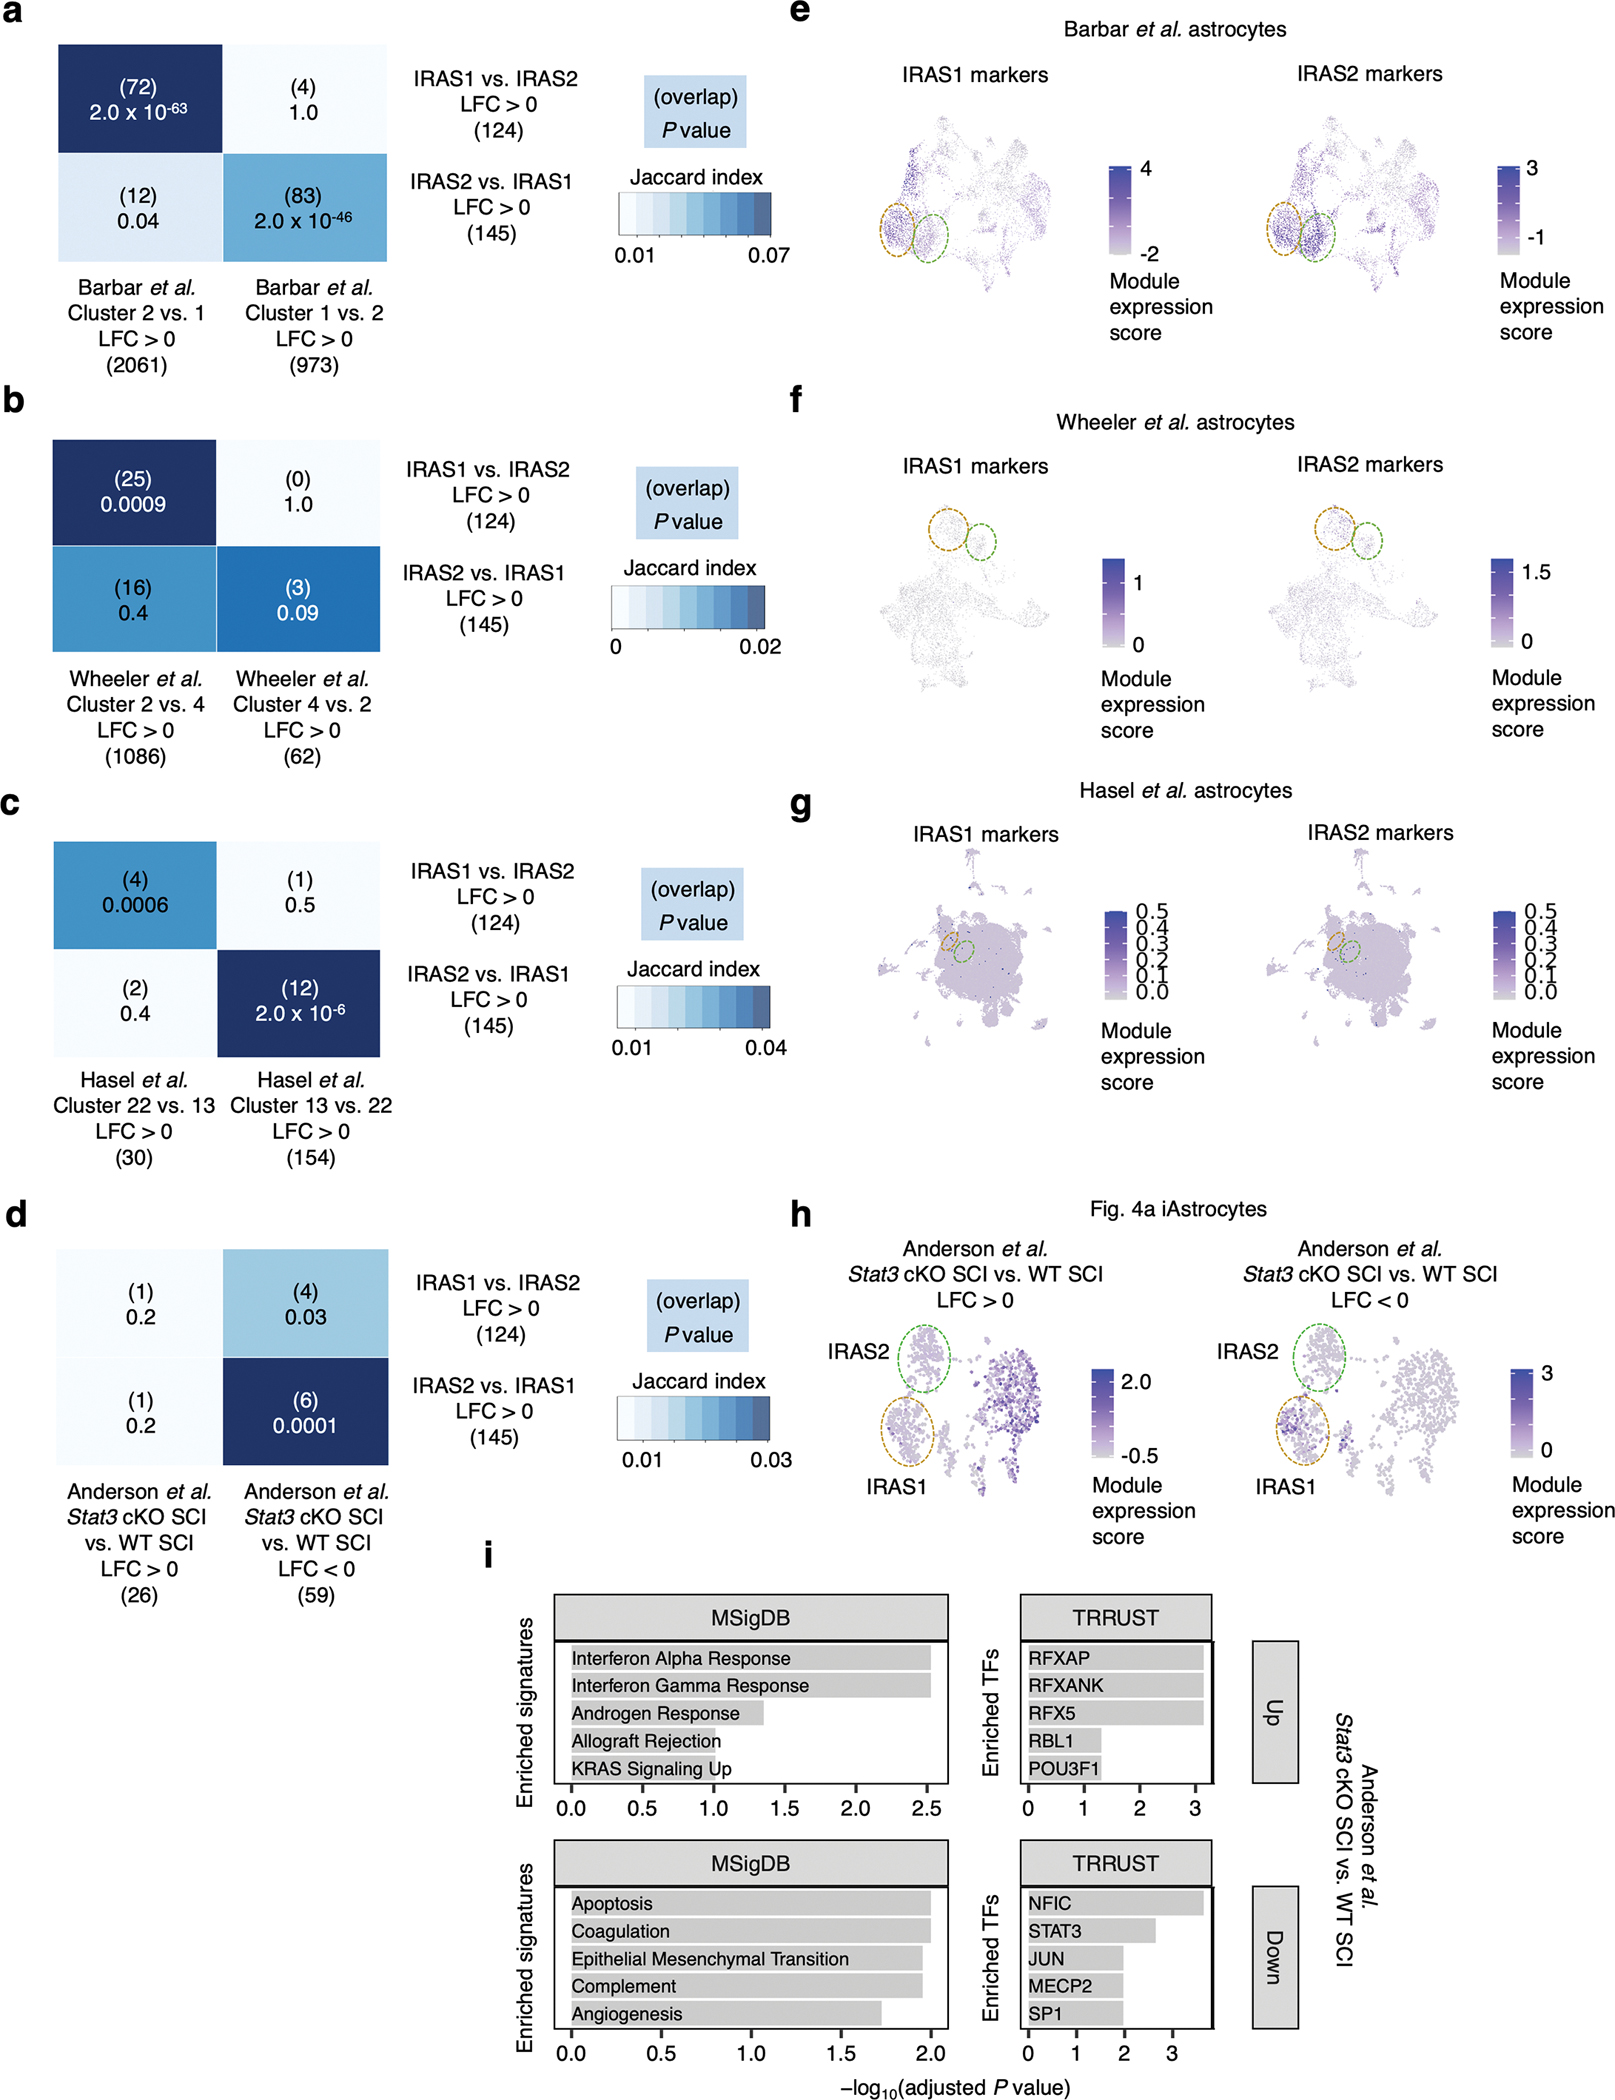
Extended Data Fig. 10 |. Overlap analysis of IRAS1 and IRAS2 markers with external datasets.

a-c, Overlap analysis (Fisher’s exact test; see Methods) of differentially expressed genes (DEGs) between IRAS1 vs. IRAS2 with DEGs between IRAS1- and IRAS2-co-clustering astrocytes from Barbar et al.18 (a), Wheeler et al.104 (b), or Hasel et al.45 (c). d, Overlap analysis of DEGs between IRAS1 vs. IRAS2 with DEGs between astrocytes from Stat3 astrocyte-specific conditional knockout (cKO) mice vs. wild-type (WT) mice subject to spinal cord injury (SCI) from Anderson et al.38. e-g, Module expression score (see Methods) of IRAS1 or IRAS2 markers overlaid onto the UMAP embedding of Barbar et al.18 (e), Wheeler et al.104 (f), or Hasel et al.45 (g) astrocytes from Fig. 7d, h, and l, respectively. h, Module expression score of upregulated vs. downregulated DEGs between astrocytes from Stat3 cKO SCI vs. WT SCI mice from Anderson et al.38 overlaid onto the UMAP embedding of iAstrocytes from Fig. 4a. i, Cellular pathway (MSigDB79) and upstream transcription factor (TRRUST80) enrichment analysis of upregulated vs. downregulated DEGs between astrocytes from Stat3 cKO SCI vs. WT SCI mice from Anderson et al.38. For panels a-d and i, P values were calculated using the two-sided Fisher’s exact test and corrected for multiple testing using the Benjamini-Hochberg method.
