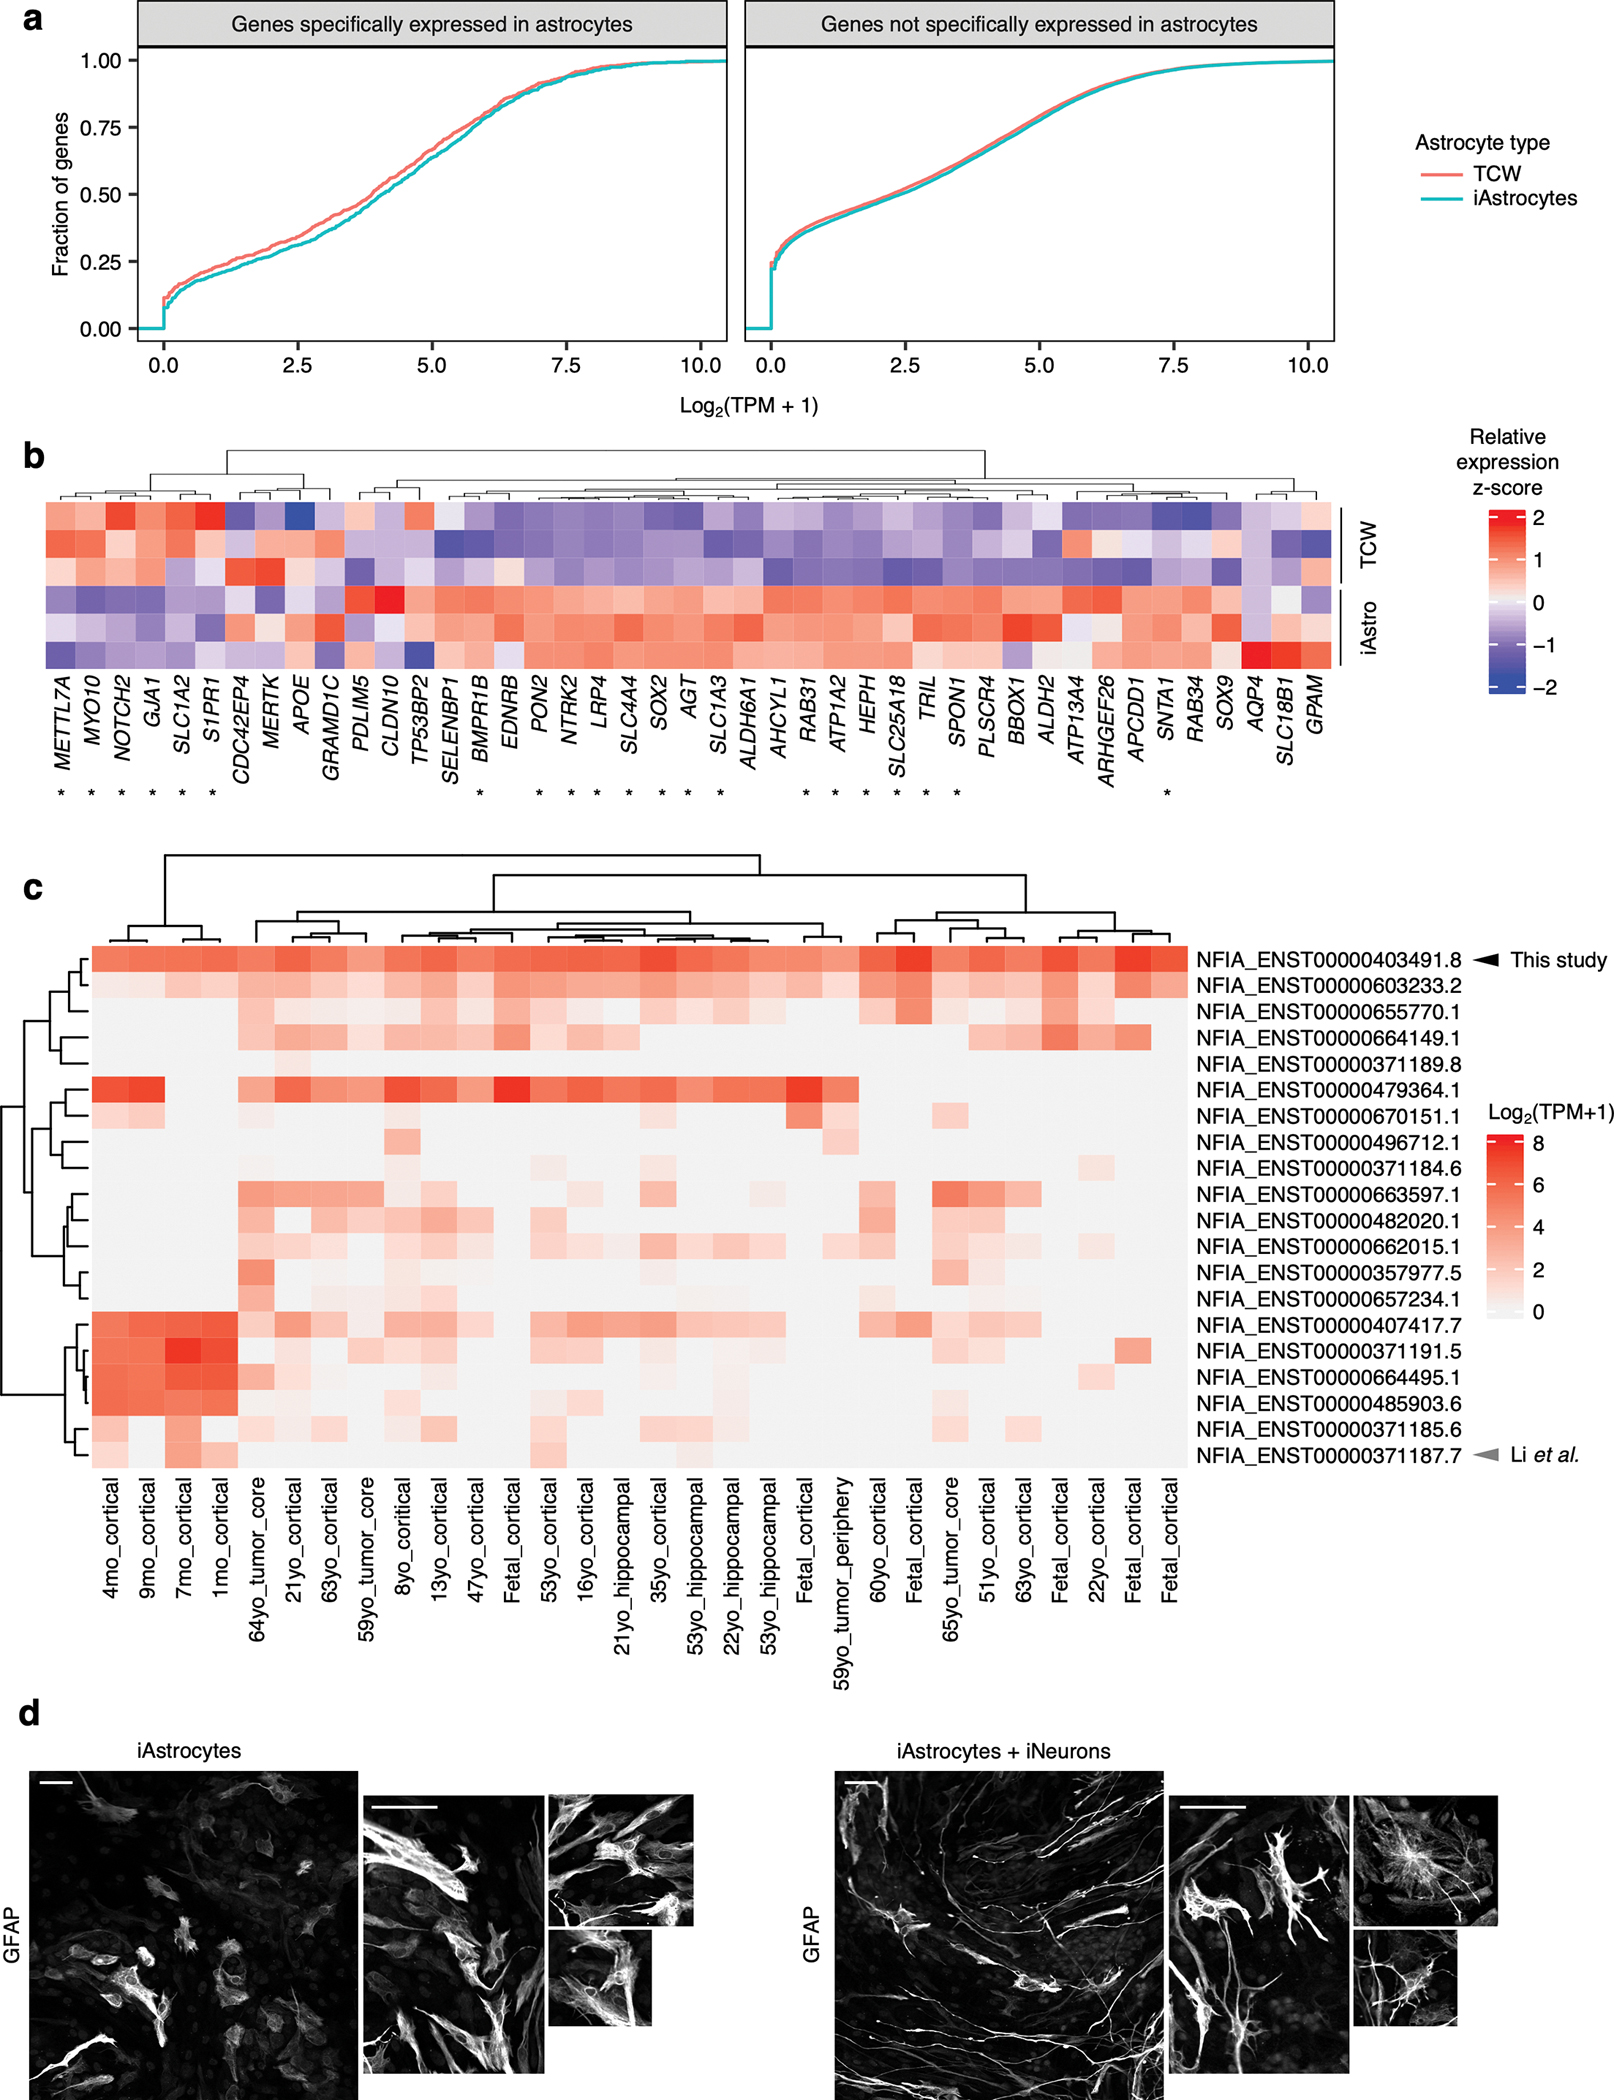
Extended Data Fig. 1 |. Additional characterization of iAstrocytes.

a, Empirical cumulative distribution functions of the mean expression of genes (averaged across experimental replicates, n = 3 wells) with astrocyte-specific expression (astrocyte fidelity > 40) or without astrocyte specific expression (astrocyte fidelity < 40) in iAstrocytes vs astrocytes generated using the TCW et al. protocol16 (TCW astrocytes). Genome-wide astrocyte fidelity scores were obtained from Kelley et al. TPM: transcripts per million. b, Relative expression (z-scored) of the top 50 genes with the highest astrocyte fidelity scores from Kelley et al.115 (organized by hierarchical clustering, see Methods) in iAstrocytes vs. TCW astrocytes (n = 3 experimental replicates corresponding to heatmap rows). Genes with statistically significant differential expression (adjusted P value < 0.1) between iAstrocytes and TCW astrocytes are marked with asterisks; P values were calculated and adjusted for multiple testing (false-discovery rate method) using DESeq2 (two-sided Wald test; see Methods). c, Heatmap of log-scaled transcripts per million (TPM) values of NFIA transcripts in human primary astrocytes from Zhang et al.92 d, Representative images from immunostaining of GFAP in iAstrocytes cultured alone or with iNeurons (n = 3 wells). In each case, an entire field of view is displayed (left) next to magnified sections (all at same scale) containing representative astrocyte morphologies (right). Scale bars correspond to 60 μm.
