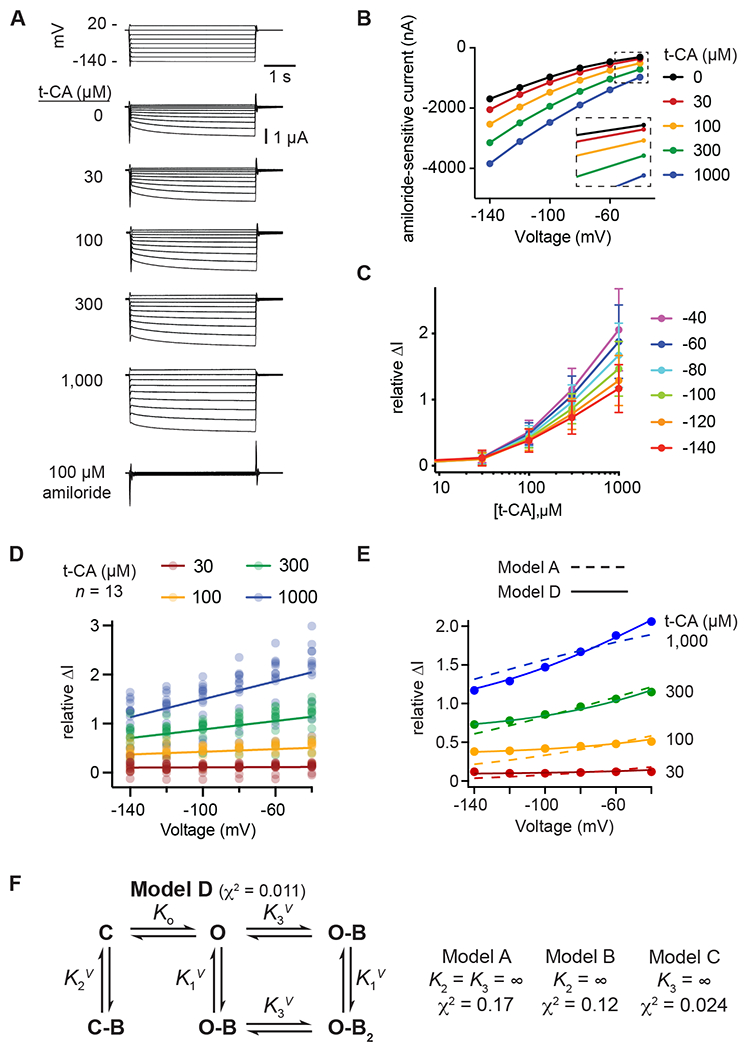
Figure 5. ENaC regulation by t-CA is voltage-dependent.

A, Oocytes expressing α, β, and γ ENaC subunits were bathed in a 110 mM Na+ solution supplemented with t-CA or amiloride as indicated. After 60 s for each t-CA dose, or 20 s for amiloride, currents were recorded while varying voltage in 20 mV steps for 4 s, as shown in the representative experiment. Steady-state currents at each voltage (recorded at 3.8 s) were subsequently analyzed. B, The amiloride-sensitive I–V curve from the representative experiment is plotted for each t-CA dose, with an inset highlighting greater relative stimulation at less negative potentials. C, The relative t-CA dose-response for each voltage is plotted and was determined as ΔI = IX/I0 – 1, where I0 and IX are the amiloride-sensitive currents at baseline and a given t-CA dose, respectively. Data shown are mean (SD), n = 13 oocytes. Individual points are shown in panel D. D-E, The t-CA dose-response data were replotted as a function of voltage, with individual data points in D and mean values in E. Linear regression was performed for each t-CA dose (D), and gave R2 values of 0.19 for 30 μM t-CA (p = 0.38), 0.98 for 100 μM t-CA (p = 0.0002), and 0.99 for both 300 and 1000 μM t-CA (p < 0.0001). F, Relative ΔI vs voltage data were fit to various models of regulation. The simplest model considered (Model A, dashed lines in panel E) had 3 states, a closed-state (C), an open-state (O), and an open-state with the bile acid bound at one site (O-B). Equilibrium constants between these states are Ko = [O]/[C] and K1 = [O][B]/[O-B], and K1 was permitted to have voltage-dependence according to K1V = K1·ezFδV/RT. Additional binding sites were defined analogously. Models A, B, and C are nested within Model D by setting the indicated binding constant(s) to ∞. The fit to the best model (Model D, solid lines in panel E) is shown.
