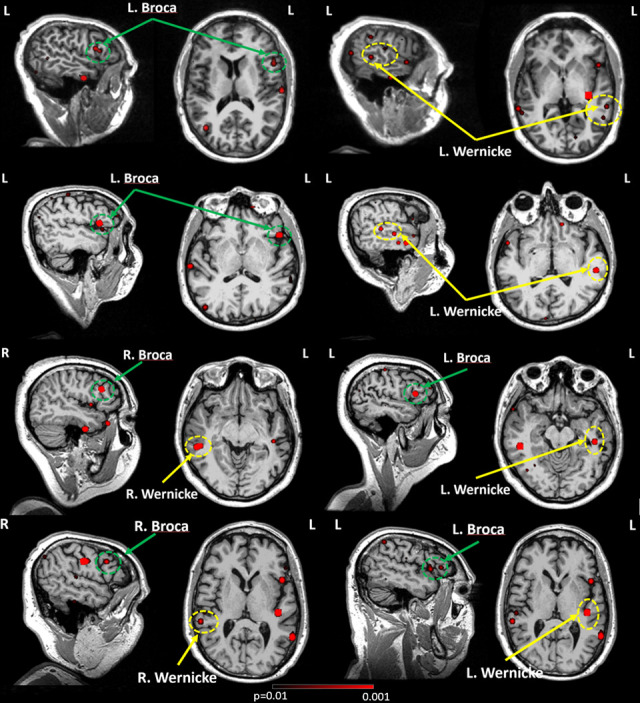
FIG. 1.

Source localization overlaid on individual MRIs. In each subject, an F-test was used to assess the statistical significance of the source magnitude (root mean square value) between a 200- and 1000-ms poststimulus interval and prestimulus baseline. The 1st and 2nd rows are for subjects (case #5 and case #20) with left hemisphere language dominance and the 3rd and 4th rows (case #10 and case #18) are for subjects with bilateral language dominance. Broca areas are in green dash circles, and Wernicke areas are in yellow dash circles.
