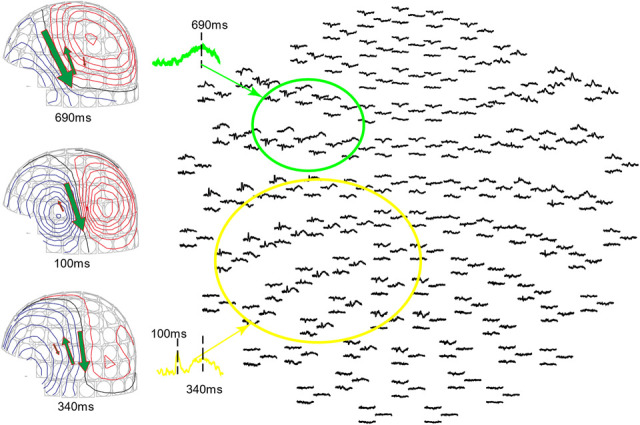
FIG. 3.

Magnetoencephalography recording waveform and contour plot of Auditory Memory Retrieval and Silent Reading Task. The sensor group in the green circle covers Broca area and the sensor group in the yellow circle covers the STG including Wernicke area. The contour plot at the middle-left shows the magnetic field and dipole location at 100 ms. The contour plot at the lower left shows the magnetic field and dipole location at 340 ms, where the posterior dipole has the largest current. The contour plot at the upper left shows the magnetic field and dipole location at 690 ms, where the anterior dipole has the largest current.
