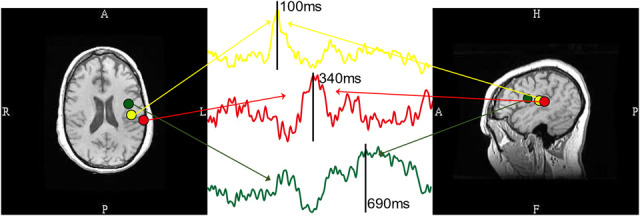
FIG. 4.

Magnetic source imaging (MSI) and dipole source waveform. Left and right images are fitting dipoles superimposed on axial and sagittal MRI images. Green, yellow and red dipoles correspond to the location of Broca area, primary auditory cortex, and Wernicke area, respectively. The dipole source waveforms are plotted in the middle image, with color-coded arrows pointing to the corresponding dipoles.
