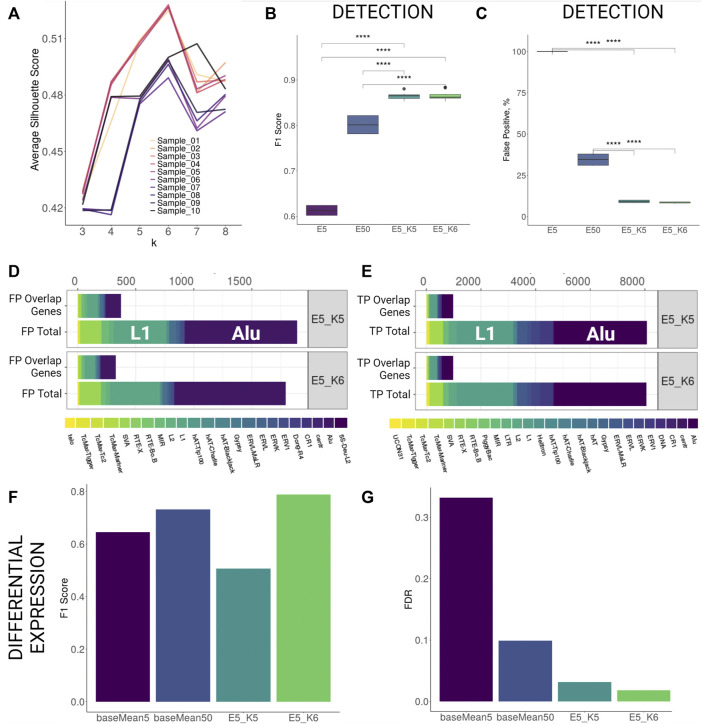
FIGURE 2.
TSS profiling improves detection and differential expression detection for human stranded simulation. (A) Average silhouette scores for different k values per each sample. Best silhouette scores for most samples are reached with k = 5 and k = 6. (B,C) F1 Score and False Positive proportions improvement with TSS profiling at the detection level. Both parameters improve significantly (Wilcoxon signed-rank test, p < 0.001) when TSS profiling is applied to elements retained with detection cutoff 5 (E5_K5 and E5_K6) as compared to only filtering by low detection cutoff (5 counts, E5) or increasing detection cutoff (50 counts, E50). (D,E) Family Composition of FP and TP hits categorized by total and overlap genes after TSS profiling (F,G) F1 Score and FDR improvement for differential expression detection with TSS profiling.

