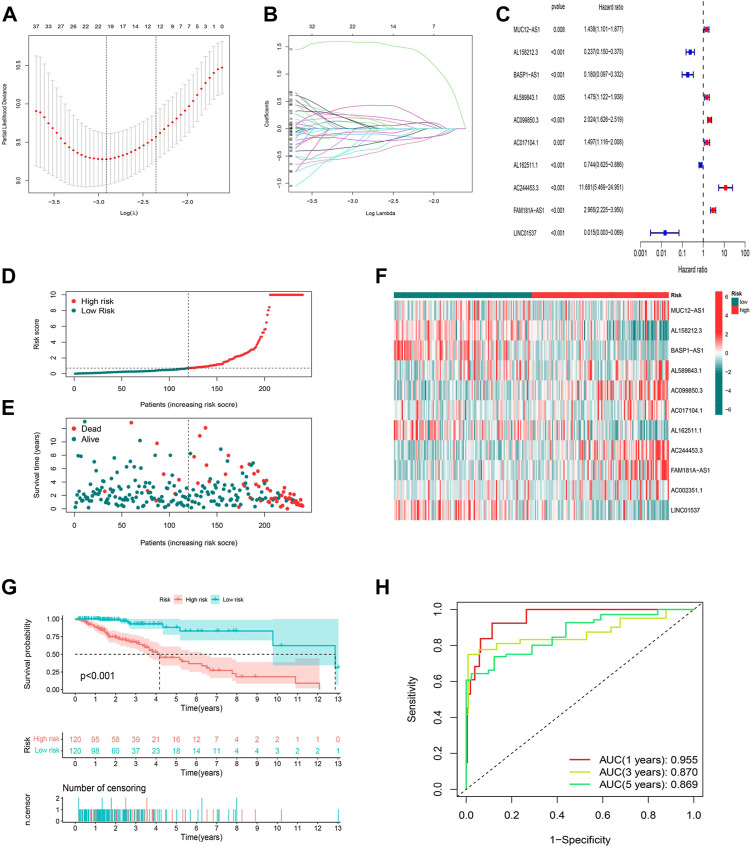
FIGURE 3.
Construction and validation of the prognostic model in the TCGA training set. (A) The LASSO coefficient profile of cuproptosis-related lncRNAs. (B) The 10-fold cross-validation for variable selection in the LASSO model. (C) Multivariate Cox regression analysis showed six independent prognostic lncRNAs. (D) Distribution of cuproptosis-related lncRNAs model-based risk score for the training set. (E) Different patterns of survival status and survival time between the high-risk and low-risk groups for the training set. (F) The clustering analysis heatmap shows the expression standards of the six prognostic lncRNAs for each patient in the training set. (G) Kaplan-Meier survival curves of the OS of high-risk and low-risk patients in the training set. (H) 1-, 3-, and 5-year ROC curve of the risk model.

