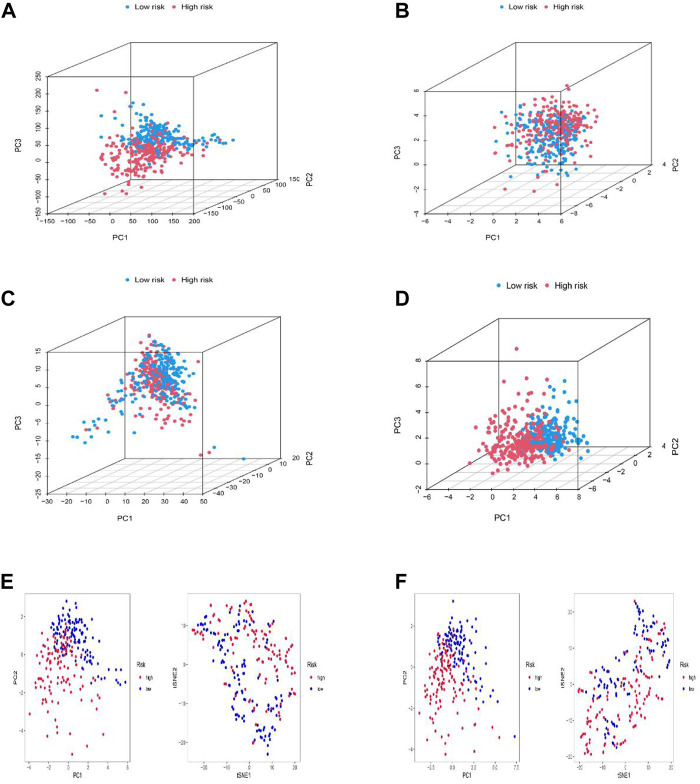
FIGURE 5.
Principal component analysis. (A–D) PCA analysis between the high and low-risk based on the whole genome expression set (A), 10 cuproptosis-related genes (B), 1272 cuproptosis-related lncRNAs (C), and risk model classified by the expression profiles of the six cuproptosis-related lncRNAs (D). (E,F) PCA and t-SNE analyses between the high and low-risk groups in the training (E) and testing sets (F).

