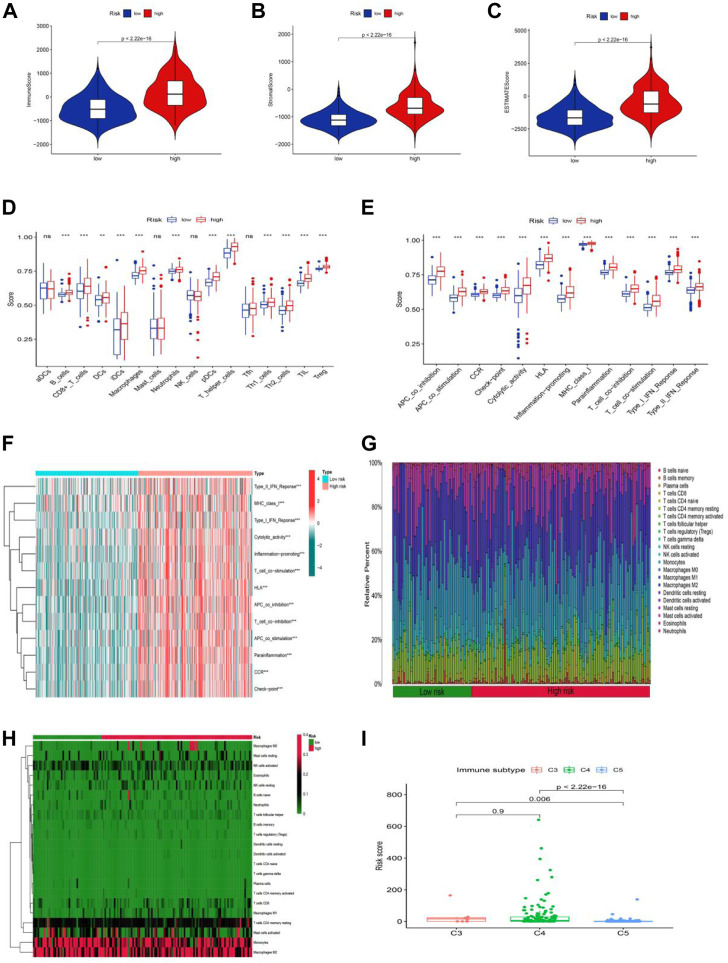
FIGURE 8.
Stratification Analysis of the cuproptosis -related lncRNA prognostic risk score in immune features. (A–C) The assessment of TME related scores between high- and low-risk groups. (D–F) The score of immune cells comparing high-risk and low-risk groups by ssGSEA Score. (G,H) Heatmap of 22 tumor-infiltrating immune cell types in low- and high-risk groups. (I) LGG patients with different immune subtypes.

