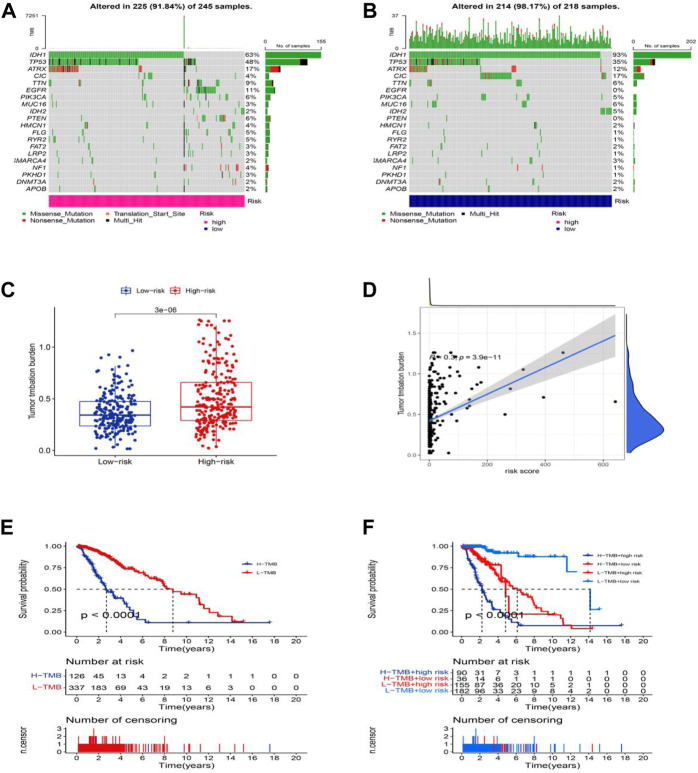
FIGURE 9.
Somatic mutation landscapes in AML. (A,B) The top 20 mutation driving genes with the highest change frequency in the high-risk and low-risk groups. (C) Differences in TMB between high and low-risk groups. (D) Correlation between TMB and risk score. (E) Kaplan-Meier survival curves of the OS of patients in the high-TMB and low-TMB groups in the entire set. (F) Kaplan-Meier survival curves of the OS of patients based on the TMB and risk scores.

