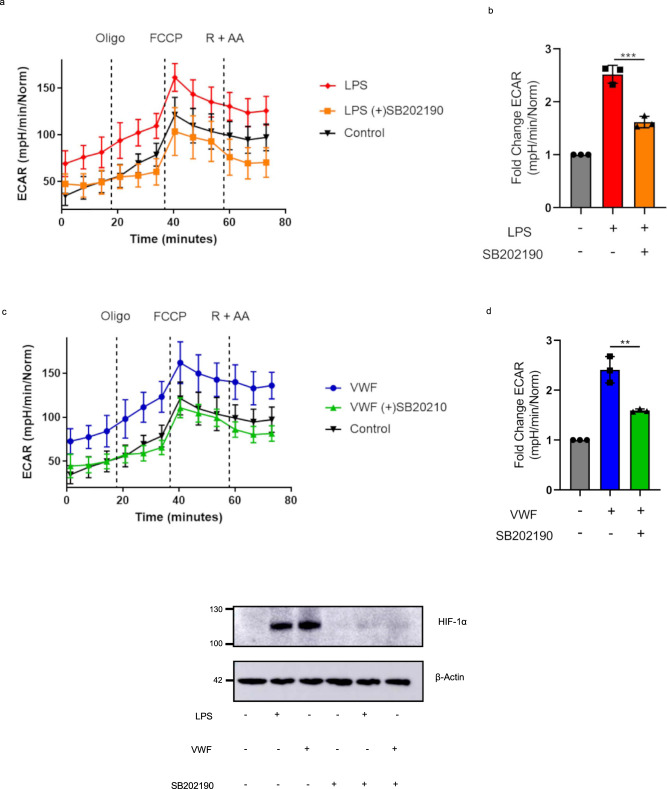
Fig. 8. p38 and HIF-1α triggered enhanced glycolysis produced following VWF stimulation.
Representative plots of BMDMs extracellular acidification rate (ECAR) and bar charts of fold change of the basal ECAR following 3 h treatment and with a, b LPS (100 ng/ml) or c, d VWF (10 μg/ml) with or without 1 h pre-treatment of p38 inhibitor, SB202190 (50 μM). Fold change ECAR was determined from three independent experiments ± SEM. Significance was determined by ANOVA (**p < 0.01). e BMDMs were treated for 3 h with pd-VWF (10 μg/ml) or LPS (100 ng/ml) with or without SB202190 (50 μM) 1 h pre-treatment. HIF-1α levels then examined by Western blot and total protein determined by β-actin. All experiments were performed in triplicate and source data for this figure are provided as a Source Data file.

