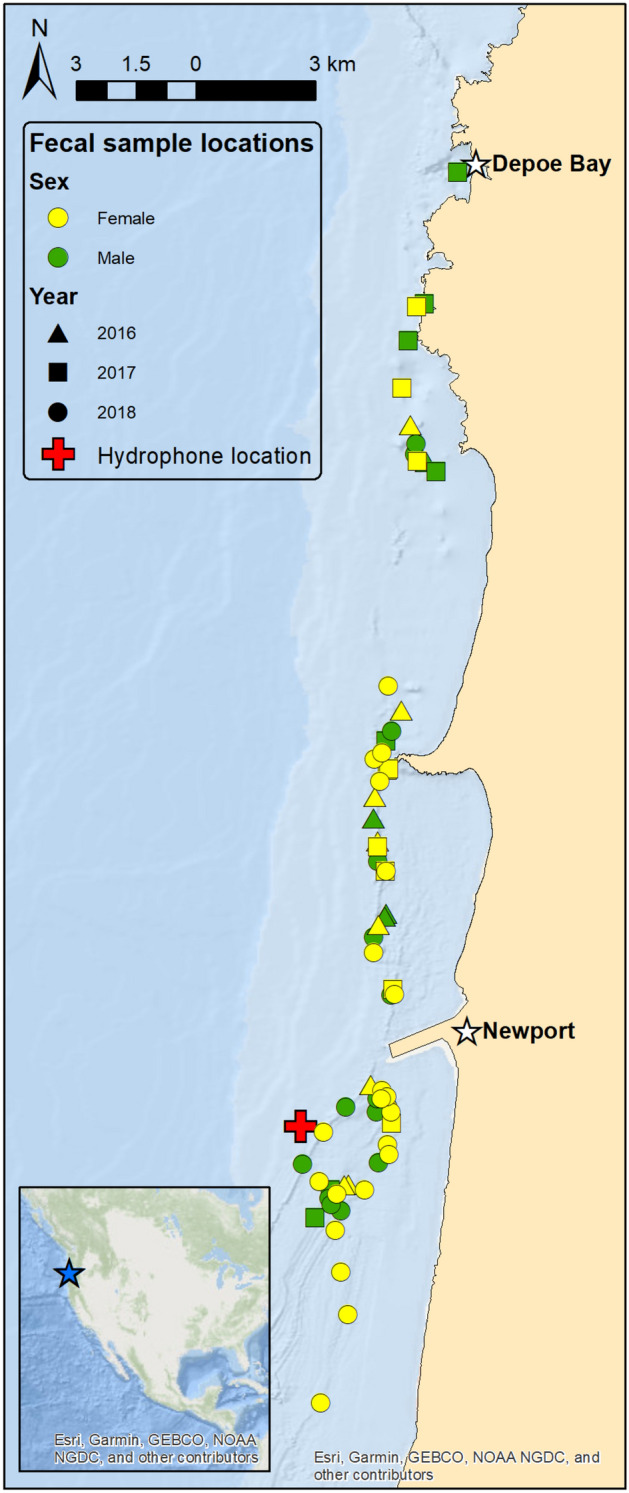
Figure 1.

Location of field site off the central Oregon, USA coast (blue star on inset map), hydrophone deployment site (red cross), and gray whale fecal sample collections symbolized by color and shape to represent sex and year. The ports of Newport and Depoe Bay are represented by white stars. The Newport white star is also representing the anemometer station (NPOW3) from which the wind speed data were retrieved from. Figure created in ArcGIS software (version 10.8).
