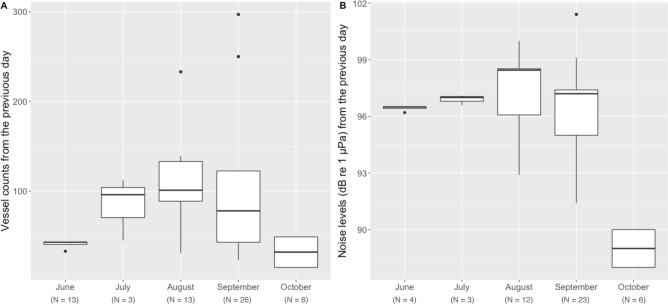
Figure 5.
Boxplots displaying the variation in (A) vessel counts in Newport and Depoe Bay (Oregon, USA) on the day previous to fecal sample collection on gray whale fecal glucocorticoid metabolite (fGC), and (B) noise levels (daily median SPLrms, in dB [re 1 μPa]; 50 Hz - 1,000 Hz) recorded on a hydrophone deployed outside the Newport harbor entrance on the day previous to fecal sample collection summarized by month during 2017 and 2018. The boxplot upper and lower limits represent the 25% and 75% quantiles, the mid-lines indicate the medians, the whiskers represent minimum and maximum values (range), and the dots indicate outliers.

