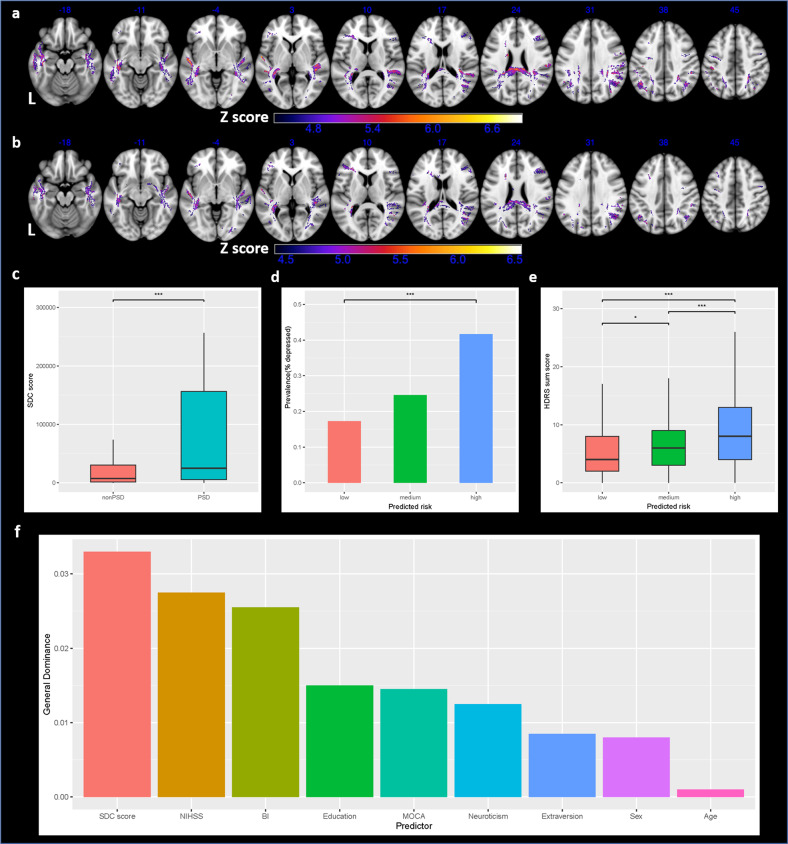
Fig. 3. Results of split-half analysis.
a, b VDSM results from dataset 1 and dataset 2, respectively; c SDC score compared between PSD and non-PSD; d true PSD prevalence compared among three risk groups defined by SDC score tertiles; e true PSD severities compared among three risk groups defined by SDC score tertiles; f averaged predictor importance of two enhanced models. Axial coordinates refer to MNI space in mm. L indicates left.

