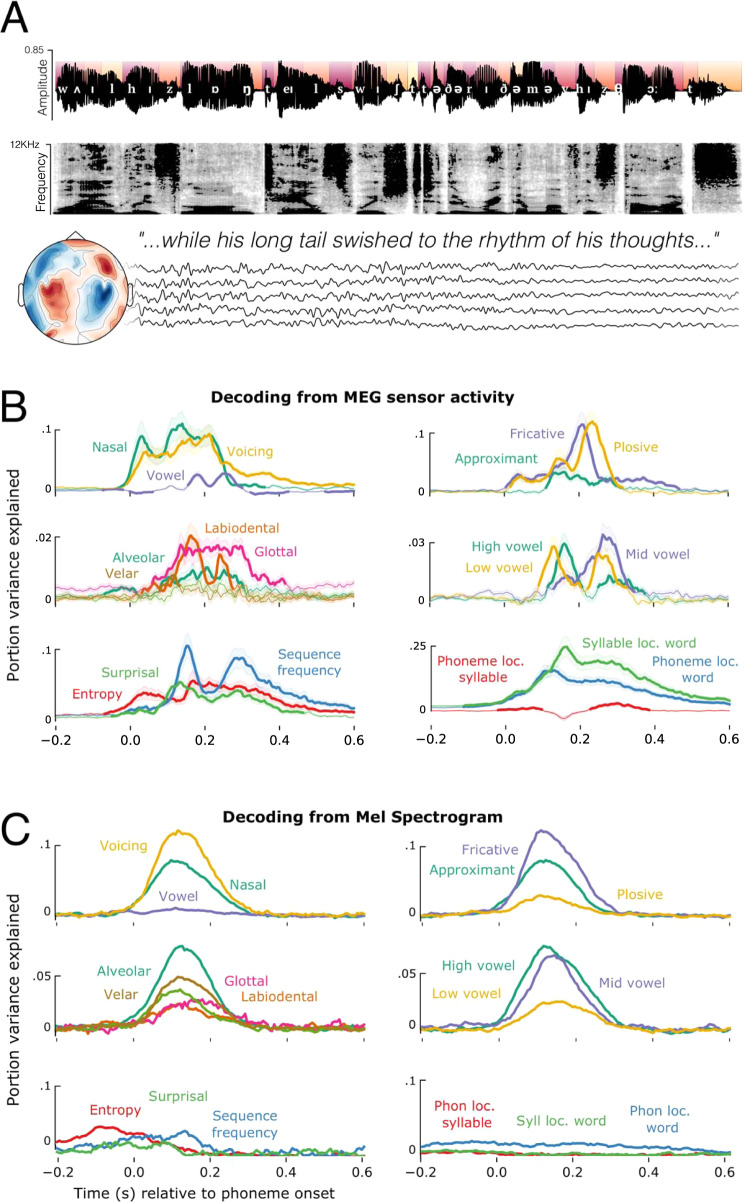
Fig. 1. Experimental design and phoneme-level decoding.
A Example sentence, with the phonological annotation superimposed on the acoustic waveform. Colours of the segments at the top half of the waveform indicate the phoneme’s distance from the beginning of a word (darker red closer to word onset). The spectrogram of the same sentence appears below the waveform. Five example sensor residual time-courses are shown below, indicating that all recordings of the continuous stories were recorded with concurrent MEG. B Timecourses of decoding phoneme-level features from the MEG signal using back-to-back regression, time-locked to phoneme onset. Traces represent the average decoding performance over the 21 participants, shading represents standard error of the mean over participants. C Timecourses of decoding the same features from the mel spectrogram. The y-axis represents portion of explainable variance given all features in the model. Source data are provided as a Source Data file.

