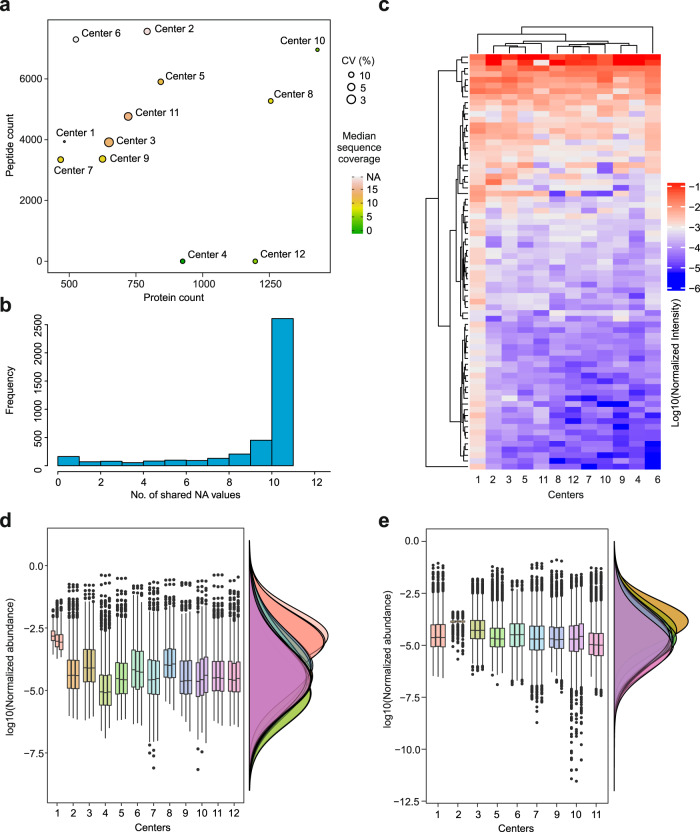
Fig. 3. Comparative protein corona proteomics analysis by the 12 cores that provided semiquantitative protein intensity information.
a Comparing the average peptide count (peptide count was not provided by cores 4 or 12), average protein count, median coefficients of variation CV (%) between the technical replicates and median protein sequence coverage (%) for 12 core facilities. b The number of missing values expectedly increased when data from different cores were merged. c Heatmap of 73 shared proteins with any number of peptides between the 12 cores. d Distribution of protein-level intensities for the 12 cores. e Distribution of peptide level intensities for 10 cores, as cores 4 and 12 did not provide peptide level intensities (center line, median; box limits contain 50%; upper and lower quartiles, 75 and 25%; maximum, greatest value excluding outliers; minimum, least value excluding outliers; outliers, more than 1.5 times of upper and lower quartiles). All analyses were based on three technical replicates.

