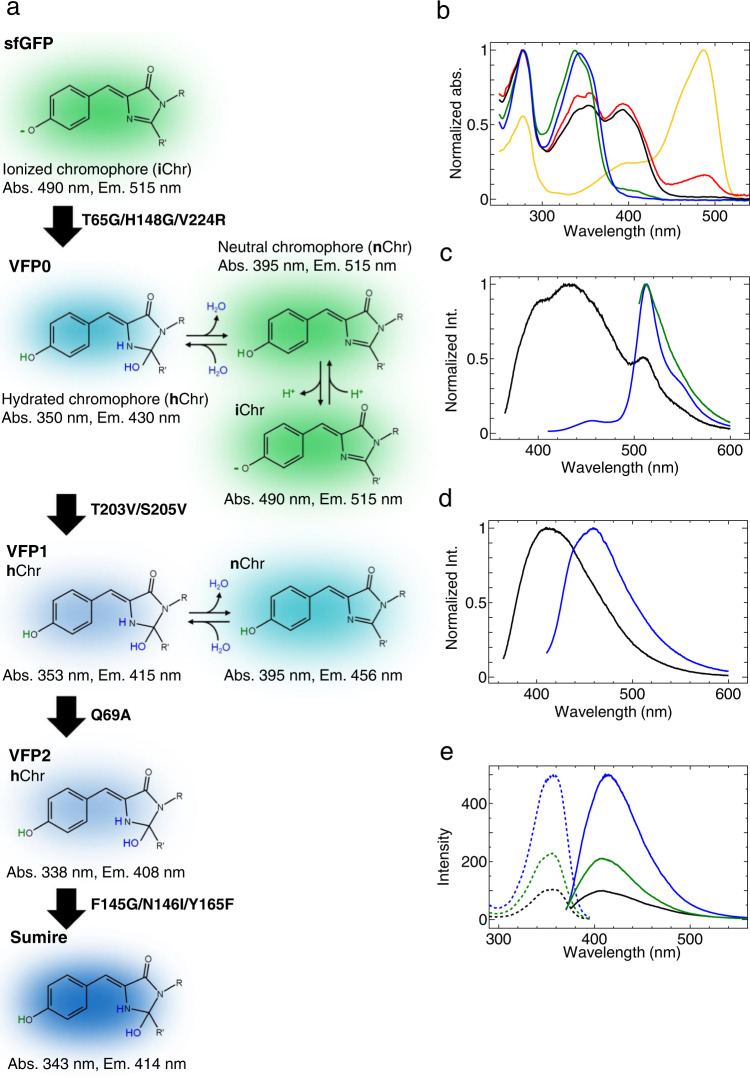
Fig. 1. Designs and spectral properties of VFPs.
a Schematic diagram of expected chromophore states of Sumire and parent proteins. b Normalized absorption spectrum of sfGFP (yellow), VFP0 (red), VFP1 (black), VFP2 (green), and Sumire (blue). c Normalized emission spectra of VFP0 excited by 350 nm (black), 395 nm (blue), and 490 nm (green). d Normalized emission spectra of VFP1 excited by 350 nm (black) and 395 nm (blue). e Excitation (dash line) and emission (solid line) spectra of VFP1 (black), VFP2 (green), and Sumire (blue). Spectra data are average measurements of independently prepared samples (n = 3).

