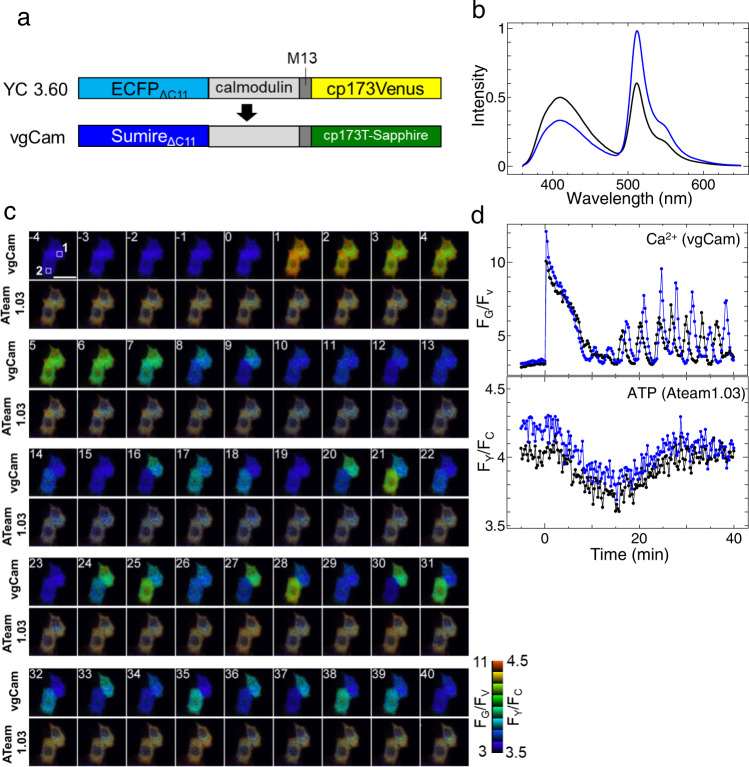
Fig. 2. Sumire-T-sapphire based FRET probe.
a Diagram of vgCam construct. b Emission spectra of vgCam in the presence of 20 μM CaCl2 (blue) and 10 mM EGTA (black). Spectra data are average measurements of independently prepared samples (n = 3). c A series of pseudo color ratio images of vgCam and ATeam1.03. Scale bar: 40 μm. d Time course of fluorescence intensity ratio of vgCam and ATeam1.03 inside ROI1 (black) and ROI2 (blue) depicted in the top-left image of c. 100 μM histamine was added at time 0.

